 Product Hunt15d ago
 Shared by @StasBekman ↗
 github.com15d ago
 Shared by @markjackmilian.bsky.social ↗
 dev.to23d ago
Originally published 23 April 2012, updated 10 September 2019 (add link to troubleshooting tool), updated 18 October 2019 (moved to Jekyll), updated 3 April 2023 with links to other tools
Test-case reducers are less well known than they should be, and those who are aware of them don’t always realise the variety of ways we can use – perhaps even abuse! – them. In this post, I’m going to explore some of the things I’ve learnt while using the
 tratt.net·Hacker News: Front Page·1mo ago·21 min read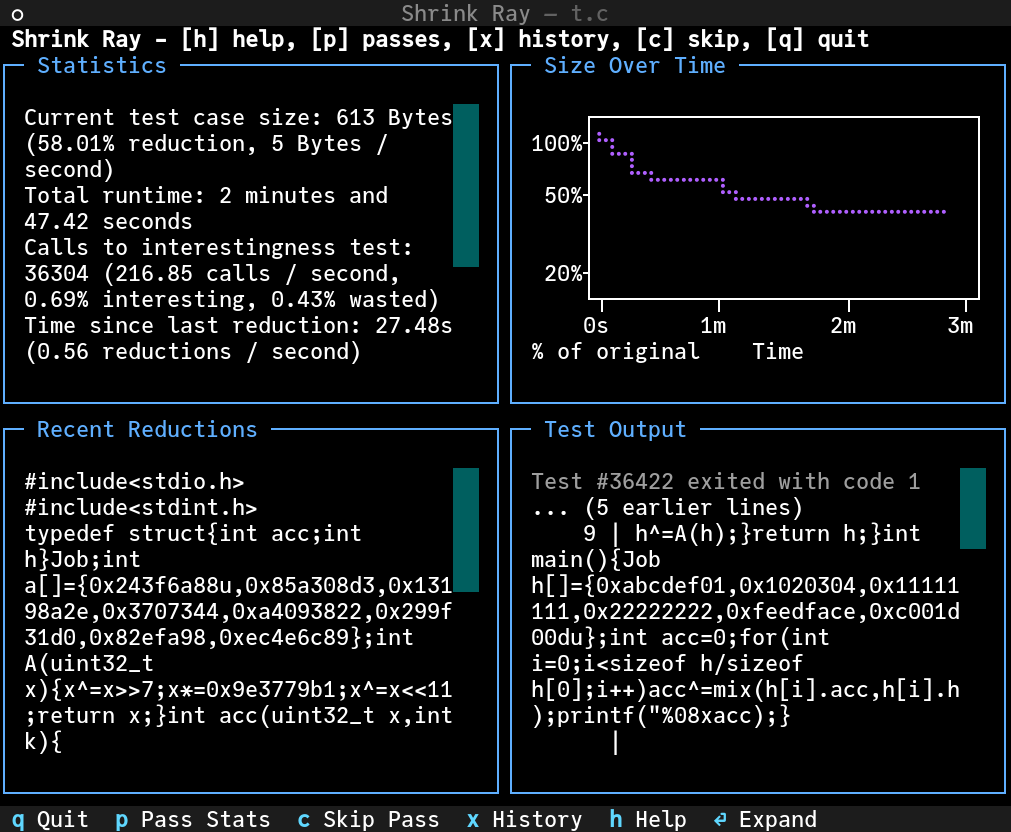

Why is my first C++ (m)allocation always 72 KB?? It’s the ’emergency pool’ for exceptions, here’s how I uncovered it using GDB and digging through the source code of libstdc++, glibc and Valgrind!
 joelsiks.com4mo ago
 blog.svgames.pl5mo ago
See what your agent did, what went wrong, and make those insights actionable.
 trails-red.vercel.app5mo ago
 mitchellh.com6mo ago
 questdb.com7mo ago
 randomascii.wordpress.com9mo ago
 blog.cloudflare.com9mo ago
 debuggingbook.org9mo ago