Reuters Climate Monitor: Real-time global temperature anomaly tracker
By
Ben Welsh
Summary
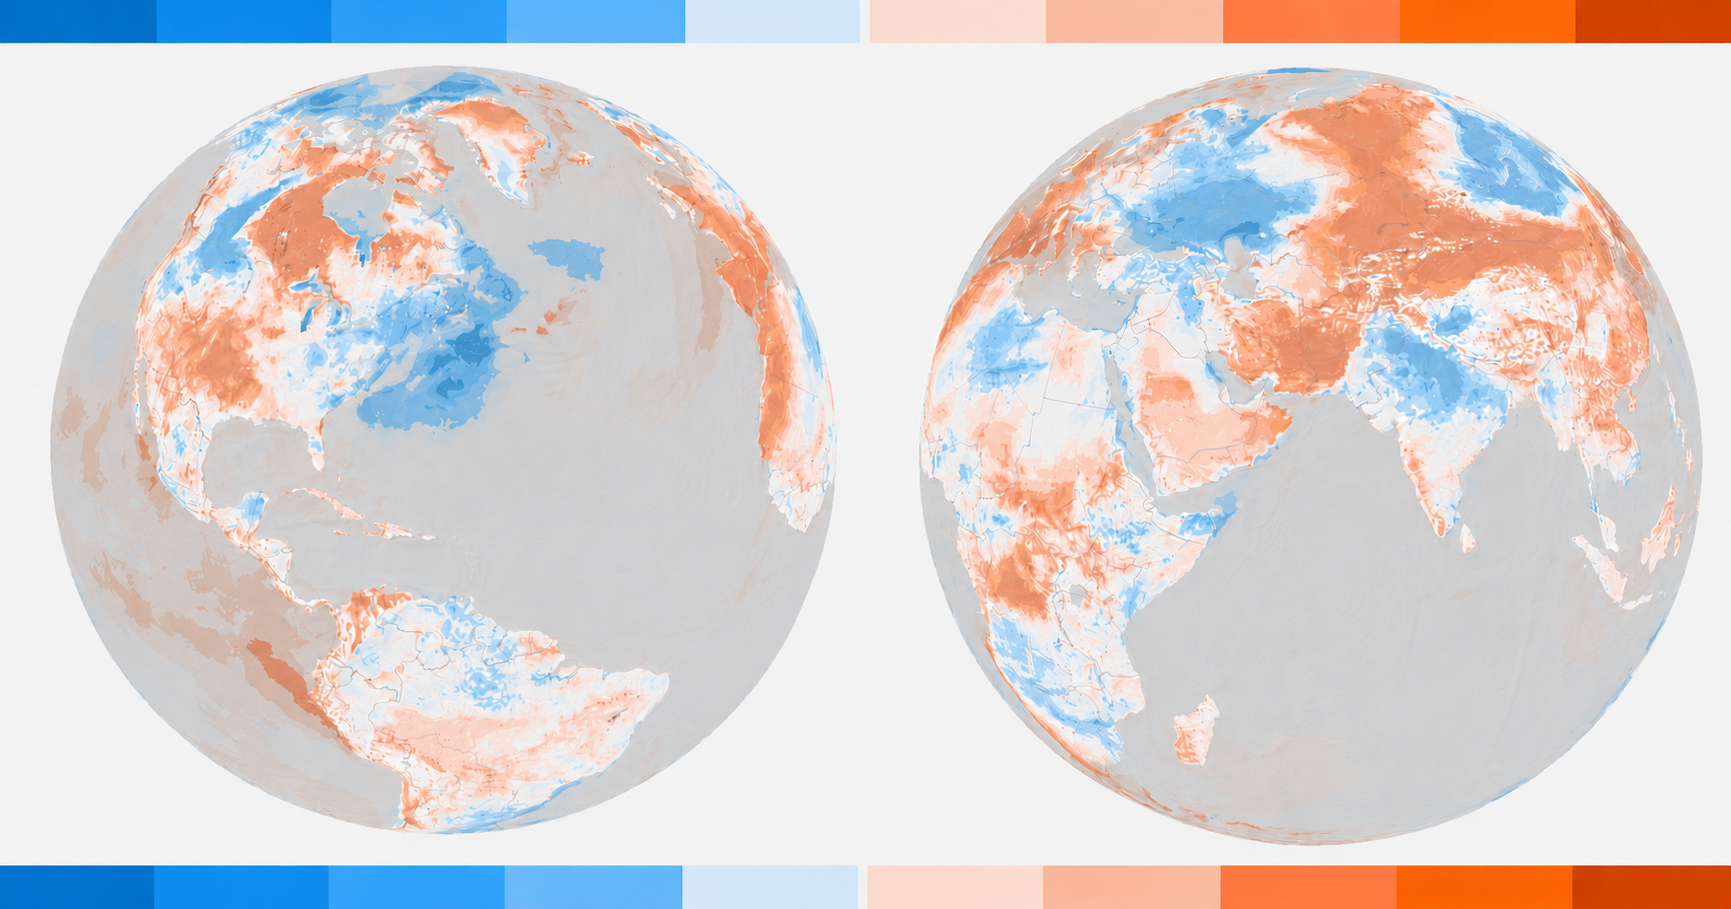
The Reuters Climate Monitor is a real-time tool that visualizes temperature anomalies across the globe by comparing current conditions to historical averages. It uses hourly temperature data from the ERA5 reanalysis dataset (1961-1990 baseline) across roughly one million grid squares covering Earth's surface. The tool shows where temperatures are unusually hot or cold compared to what was typical in the past.
Source
 bskyReuters Climate Monitor: Real-time global temperature anomaly trackerreuters.com
Key quotes
· 3 pulledThe Reuters Climate Monitor shows where temperatures are unusually hot or cold in real time by comparing today's conditions with what was typical in the past.
Using hourly temperature records from the ERA5 reanalysis dataset published by the European Centre for Medium-Range Weather Forecasts' Copernicus program, we calculate the typical temperatures for each of roughly one million grid squares covering the Earth's surface for each day of the calendar year.
The normal values are drawn from a 30-year window spanning 1961 to 1990, a standard reference period for climate analysis.
You might also wanna read

NASA Earth Now Dashboard: Real-Time Satellite Observations of Our Changing Planet
NASA's Earth Now Dashboard provides near real-time satellite observations of Earth's land, ecosystems, water, air temperature, and climate.
 svs.gsfc.nasa.gov·11h ago
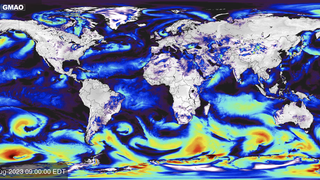
41-Year Timelapse of Daily Ocean Temperature Anomalies (1985-Present)
A 41-year timelapse visualization of daily ocean temperature anomalies from January 1985 to present, highlighting specific oceanographic phe
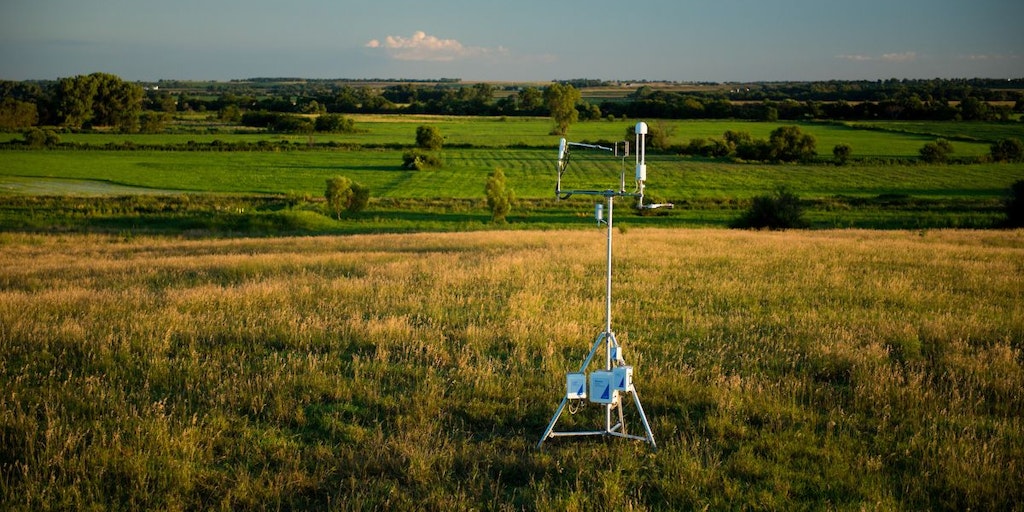
Hyphen Global's Atmospheric Measurement System for Real-Time Greenhouse Gas Removal Quantification
Hyphen Global offers an atmospheric-based measurement, reporting, and verification solution that provides real-time quantification of greenh
 Product Hunt·2mo ago
El Niño: Climate Phenomenon, Food Security Risks, and Anticipatory Action
El Niño is a natural climate phenomenon characterized by warming of surface waters in the central and eastern Pacific Ocean, occurring every
 fao.org·3d ago
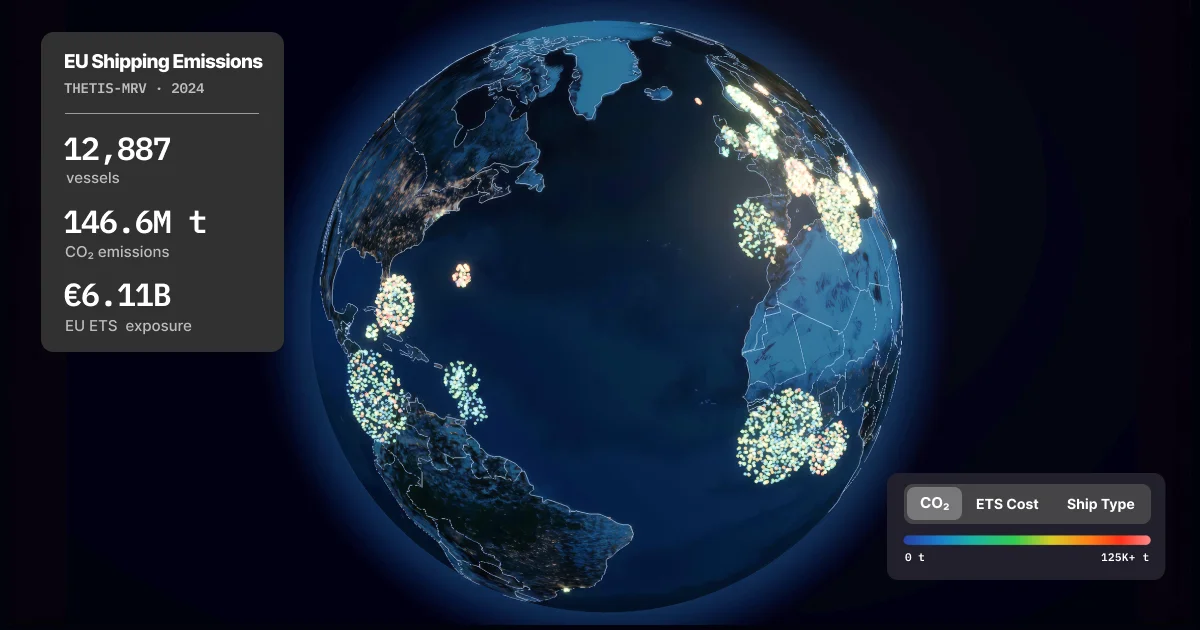
Interactive 3D Globe Visualizes EU Shipping Emissions Data (2018-2024)
An interactive 3D data visualization tool showing seven years of EU shipping emissions data (2018-2024) from the THETIS-MRV system. The visu
 seafloor.pages.dev·3mo ago
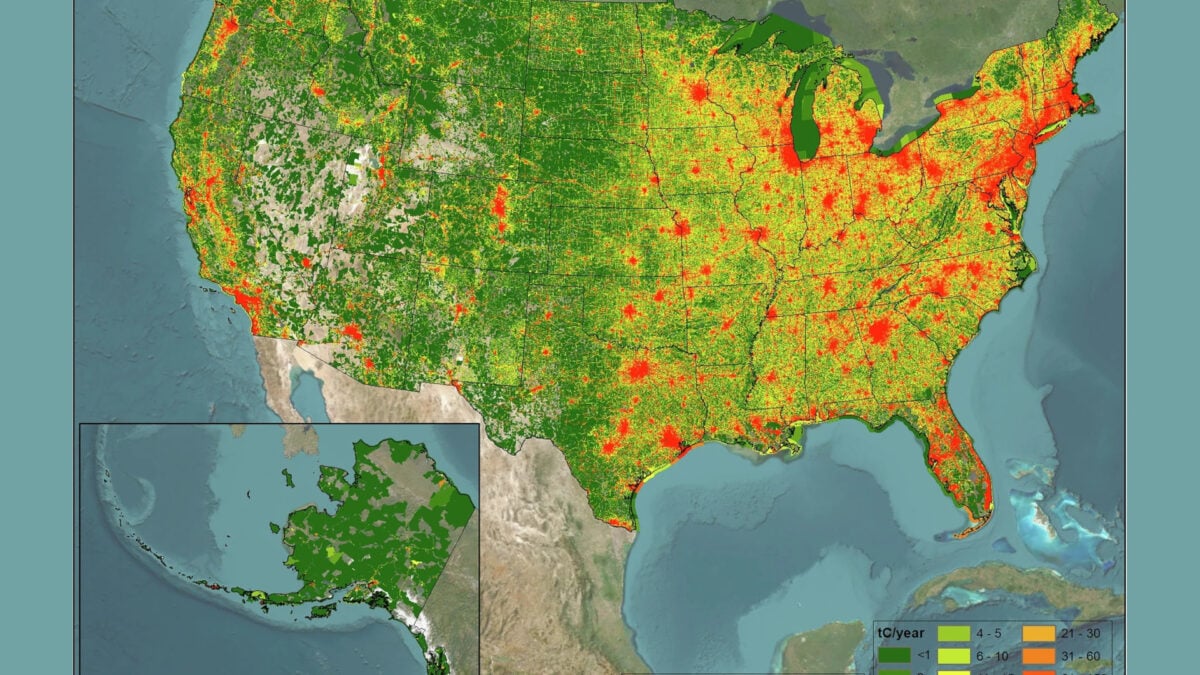
New High-Resolution Dataset Maps U.S. Carbon Emissions at Unprecedented Detail
Researchers have released the fourth version of Vulcan, a comprehensive dataset that maps CO2 emissions from fossil fuel combustion across t
 gizmodo.com·6mo ago
Comments
Sign in to join the conversation.
No comments yet. Be the first.