Interactive 3D Globe Visualizes EU Shipping Emissions Data (2018-2024)
Interactive 3D globe visualizing seven years of EU shipping emissions data (2018–2024) from THETIS-MRV. 12,000+ vessels per year, filterable by ship type, flag state, and emissions metrics.
Read the full articleYou might also wanna read
EU ETS: Shipping contributes up to €9B to EU and national budgets
A new study by European Shipowners


Europe’s congestion is costing fleets millions in wasted fuel, new Geotab data reveals
Geotab, a global leader in connected vehicle and asset management solutions, today revealed that more than 1.58 million litres of fuel were
Econometric modeling of ocean eddy kinetic energy and Atlantic Meridional Overturning Circulation transport with implications for Sustainable Development Goal 14
Econometric modeling of ocean eddy kinetic energy and Atlantic Meridional Overturning Circulation transport with implications for Sustainabl
EU ETS “paying off massively” as industrial emissions fall 41% in 2021-23 -report
The EU Emissions Trading System (ETS) reduced emissions from covered industrial installations by an estimated 41% between 2021 and 2023, equ
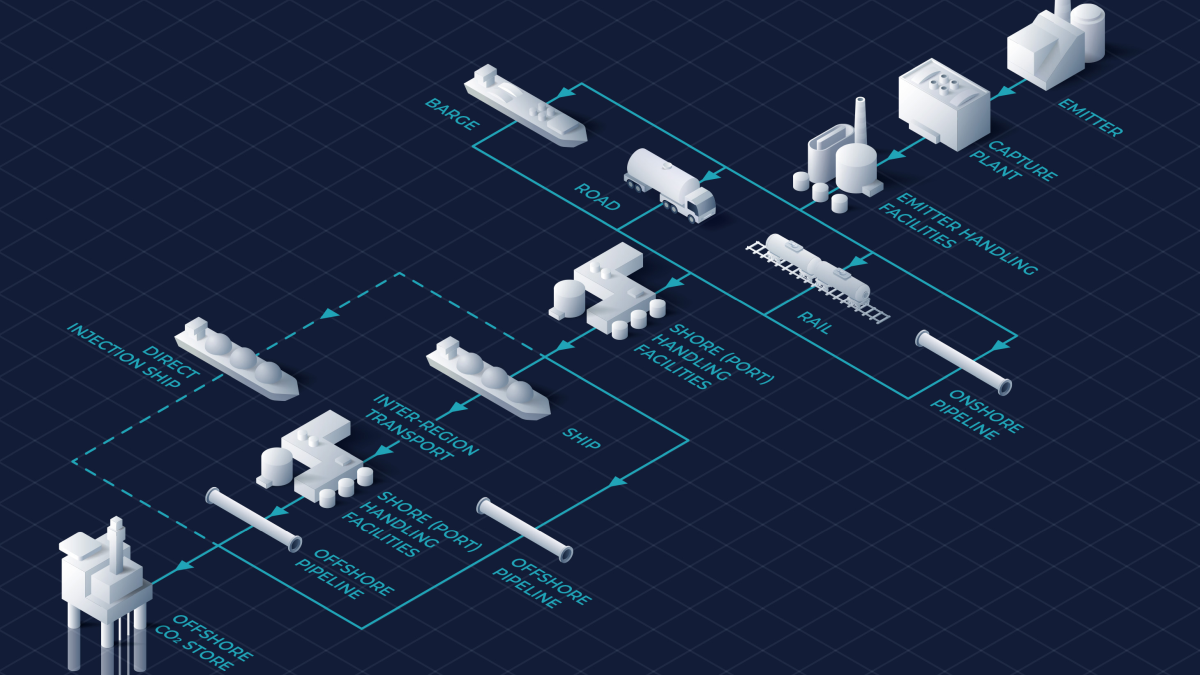
Europe will need 65 CO2 ships and 33 ports for carbon capture infrastructure by 2050, forecast says
A fleet of vessels and half of existing well-positioned ports required to build up offshore carbon capture and storage infrastructure at the
An Eye on Methane: International Methane Emissions Observatory 2023 Report
An Eye on Methane: International Methane Emissions Observatory 2023 Report An Eye on Methane: the road to radical transparency takes stock o
Comments
Sign in to join the conversation.
No comments yet. Be the first.