 Shared by @danneidle.bsky.social on Bluesky ↗
 Shared by @pamplink.bsky.social on Bluesky ↗
 Shared by @jamiemaguire.bsky.social on Bluesky ↗
 github.com14d ago
This article presents a visualization tool that tracks the Elo ratings of flagship AI models over time on the Arena AI Leaderboard. It explains that AI labs frequently update models post-launch, leading users to report perceived "nerfs" such as excessive quantization, aggressive censorship, or behavioral degradation. The chart plots each model's public Elo l
 mayerwin.github.io17d ago
 Product Hunt27d ago
This article presents a data visualization and analysis of the peak bloom dates of Kyoto's cherry blossoms, recorded continuously for over 1,200 years (812–2026). It is the longest continuous record of any natural phenomenon on Earth, with 838 observations across 1,215 years. The
 jivx.com·Hacker News: Front Page·1mo ago·76 min read
HEALPix (Hierarchical Equal Area isoLatitude Pixelisation of a 2-sphere) is an algorithm for pixelisation of the 2-sphere and associated map projections, devised in 1997 by Krzysztof M. Górski at the Theoretical Astrophysics Center in Copenhagen, Denmark. It provides a hierarchic
 en.wikipedia.org·Hacker News: Front Page·1mo ago·8 min read

 torch.football1mo ago
The article presents an interactive reference tool called 'The Cheese Map' that visualizes the combinatorial space of cheesemaking by mapping every intersection of key variables: milk type, texture, rind, aging, and processing techniques. It reveals where cheeses exist, where they're rare, and identifies gaps in the cheese landscape - combinations that haven
 cheesemap.netlify.app1mo ago
 opensource.posit.co1mo ago
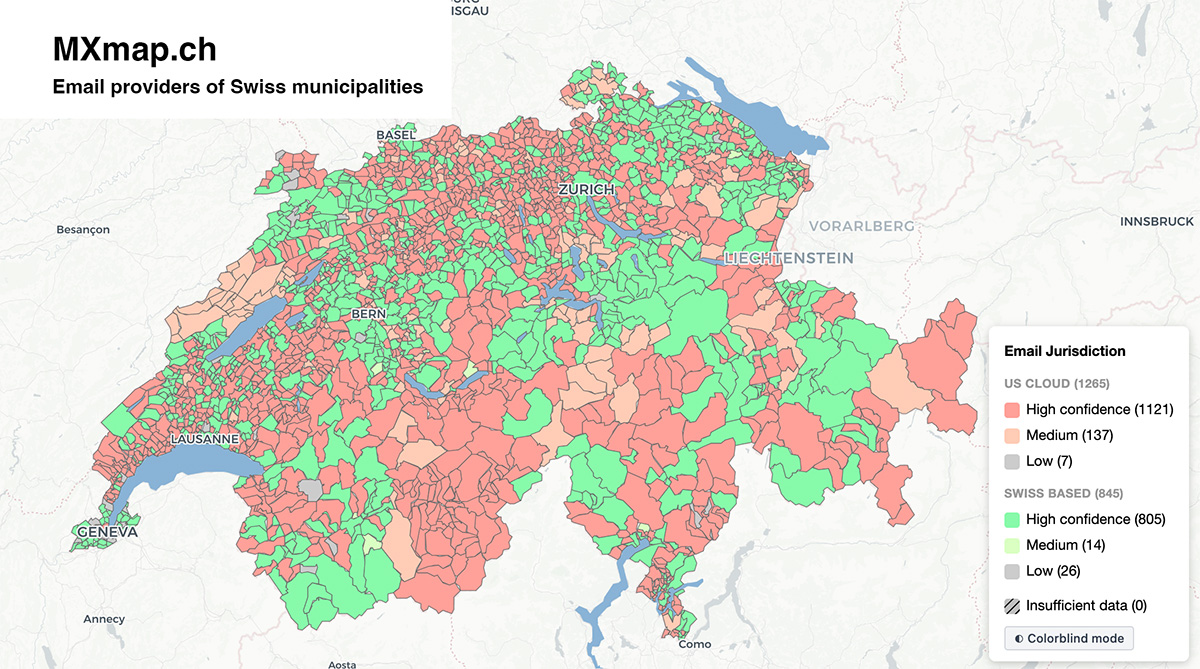
 mxmap.ch1mo ago
 github.com1mo ago
 Product Hunt1mo ago