ggsql: Grammar of Graphics Implementation for SQL Visualization
By
thomasp85
A five-star bake. Worth schmearing, sharing, saving.
Summary
ggsql is a new tool that implements the grammar of graphics (like ggplot2) using SQL syntax, allowing users to create data visualizations directly within SQL queries. The alpha release announcement explains the motivation behind developing this tool, provides examples of its usage, and demonstrates how it brings structured visualization support to SQL environments like Quarto, Jupyter notebooks, Positron, and VS Code.
Key quotes
· 4 pulledggsql is an implementation of the grammar of graphics based on SQL syntax, bringing rich, structured visualization support to SQL.
It is ready for use in Quarto, Jupyter notebooks, Positron and VS Code among others.
Introducing ggsql, a grammar of graphics for SQL that lets you describe visualizations directly inside SQL queries.
In this post we will go over some of the motivations that lead us to develop this tool, as well as give you ample examples of its use.
You might also wanna read

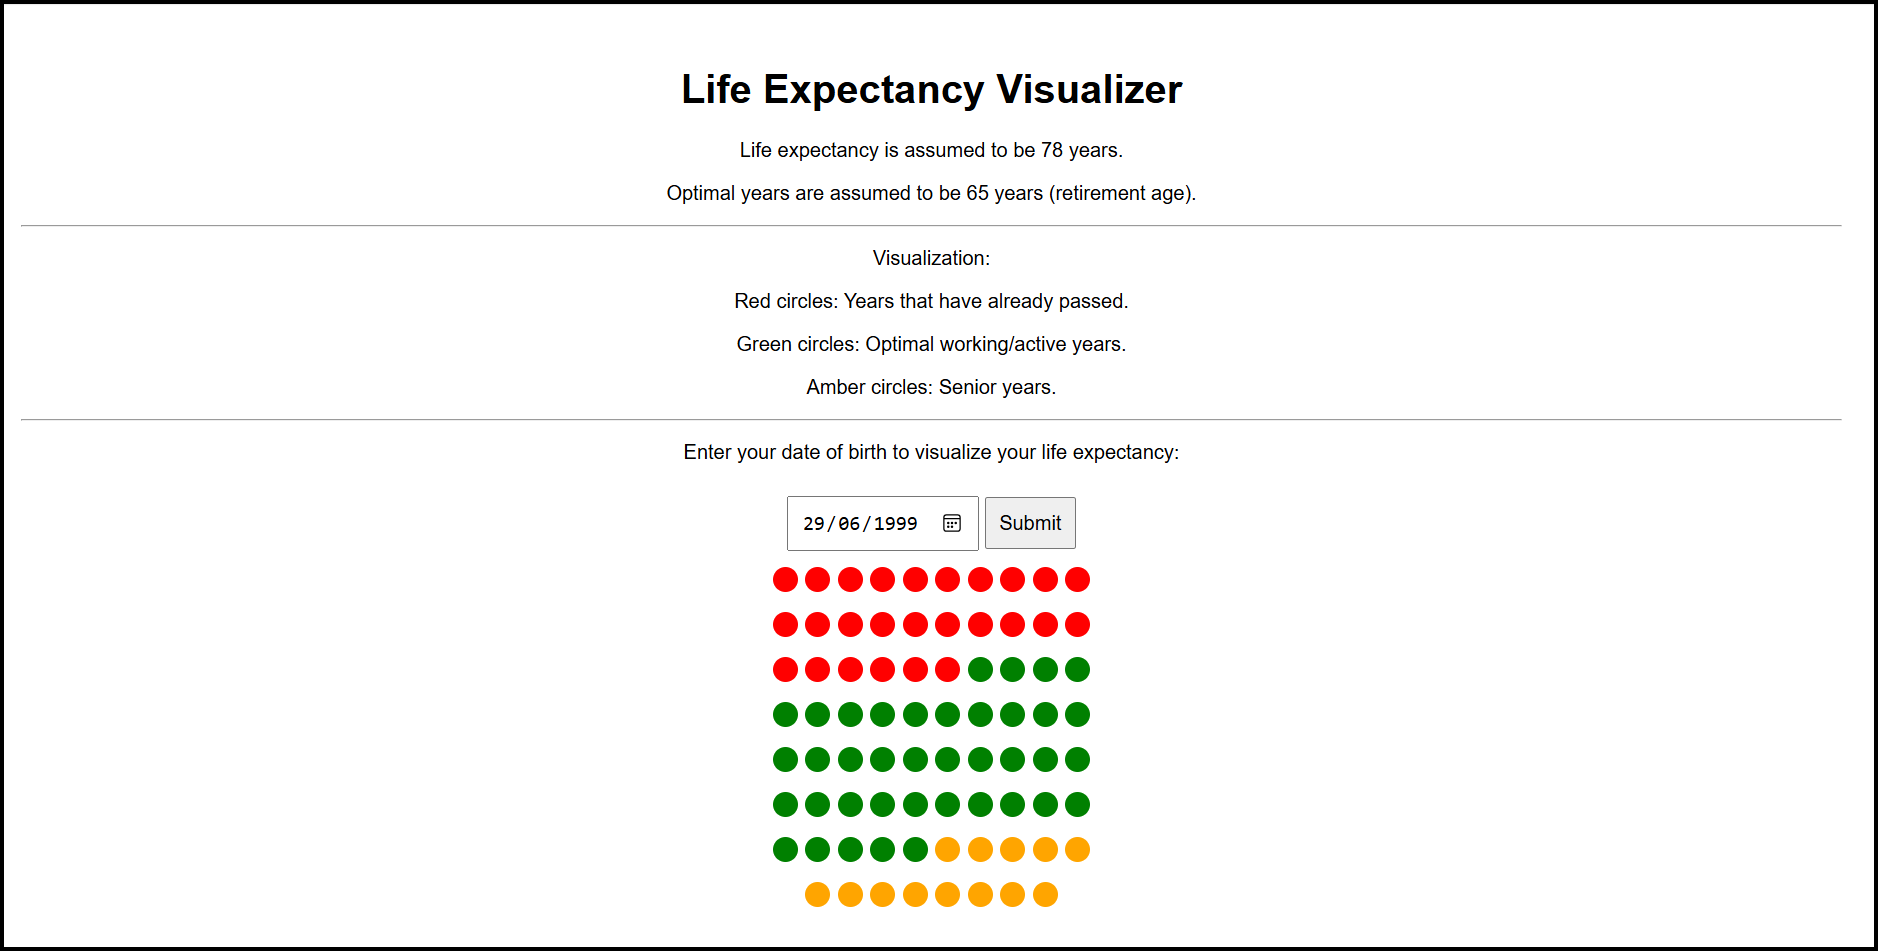
Building a Life Expectancy Visualizer with GPT-4o in Minutes
The author reflects on their birthday and time passing, then describes building a life expectancy visualizer web tool using GPT-4o in under
MDV: A Markdown Superset for Documents, Dashboards, and Slides with Embedded Data Visualizations
MDV is a Markdown superset that extends CommonMark with four key additions for creating documents, dashboards, and slides with embedded data
 github.com·1mo ago
Flight Viz: Real-Time 3D Flight Tracking with 10,000+ Aircraft on Interactive Globe
Flight Viz is a web-based 3D flight tracking tool that displays over 10,000 live aircraft on an interactive globe with real-time data, weath
 Product Hunt·1mo ago
Shaper: Open-Source SQL-Powered Data Visualization Tool Using DuckDB
Shaper is an open-source, SQL-driven data visualization and dashboard tool powered by DuckDB. It allows users to build analytics dashboards
github.com·3mo ago
ChartGPU: Open-Source WebGPU-Based Charting Library for High-Performance Data Visualization
ChartGPU is an open-source TypeScript charting library built on WebGPU technology that enables high-performance, interactive data visualizat
github.com·4mo ago
Reverse Engineering YouTube's 'Most Replayed' Graph: A Technical Exploration
This article is an interactive exploration and technical analysis of YouTube's 'Most Replayed' graph feature. The author begins with a perso
 priyavr.at·4mo ago