Reverse Engineering YouTube's 'Most Replayed' Graph: A Technical Exploration
By
prvt
Baker's choice. Dense with flavour, light on filler.
Summary
This article is an interactive exploration and technical analysis of YouTube's 'Most Replayed' graph feature. The author begins with a personal anecdote about discovering the feature while listening to music, then delves into reverse-engineering how YouTube calculates and displays the graph that shows which parts of videos are replayed most frequently. The 7,649-word article likely examines the engineering, algorithms, and data visualization techniques behind this YouTube feature, providing insights into how the platform tracks user engagement patterns and presents this data to viewers.
Key quotes
· 4 pulledI slid my mouse over the progress bar to hear the transition again. A small graph appeared, indicating...
An interactive exploration of the engineering behind YouTube's 'Most Replayed' graph.
The title read: Joe Hisaishi - One Summer's Day. 'Of course, it was from Spirited Away.'
A melody felt familiar, but I couldn't quite place it, spirited away by my work.
You might also wanna read

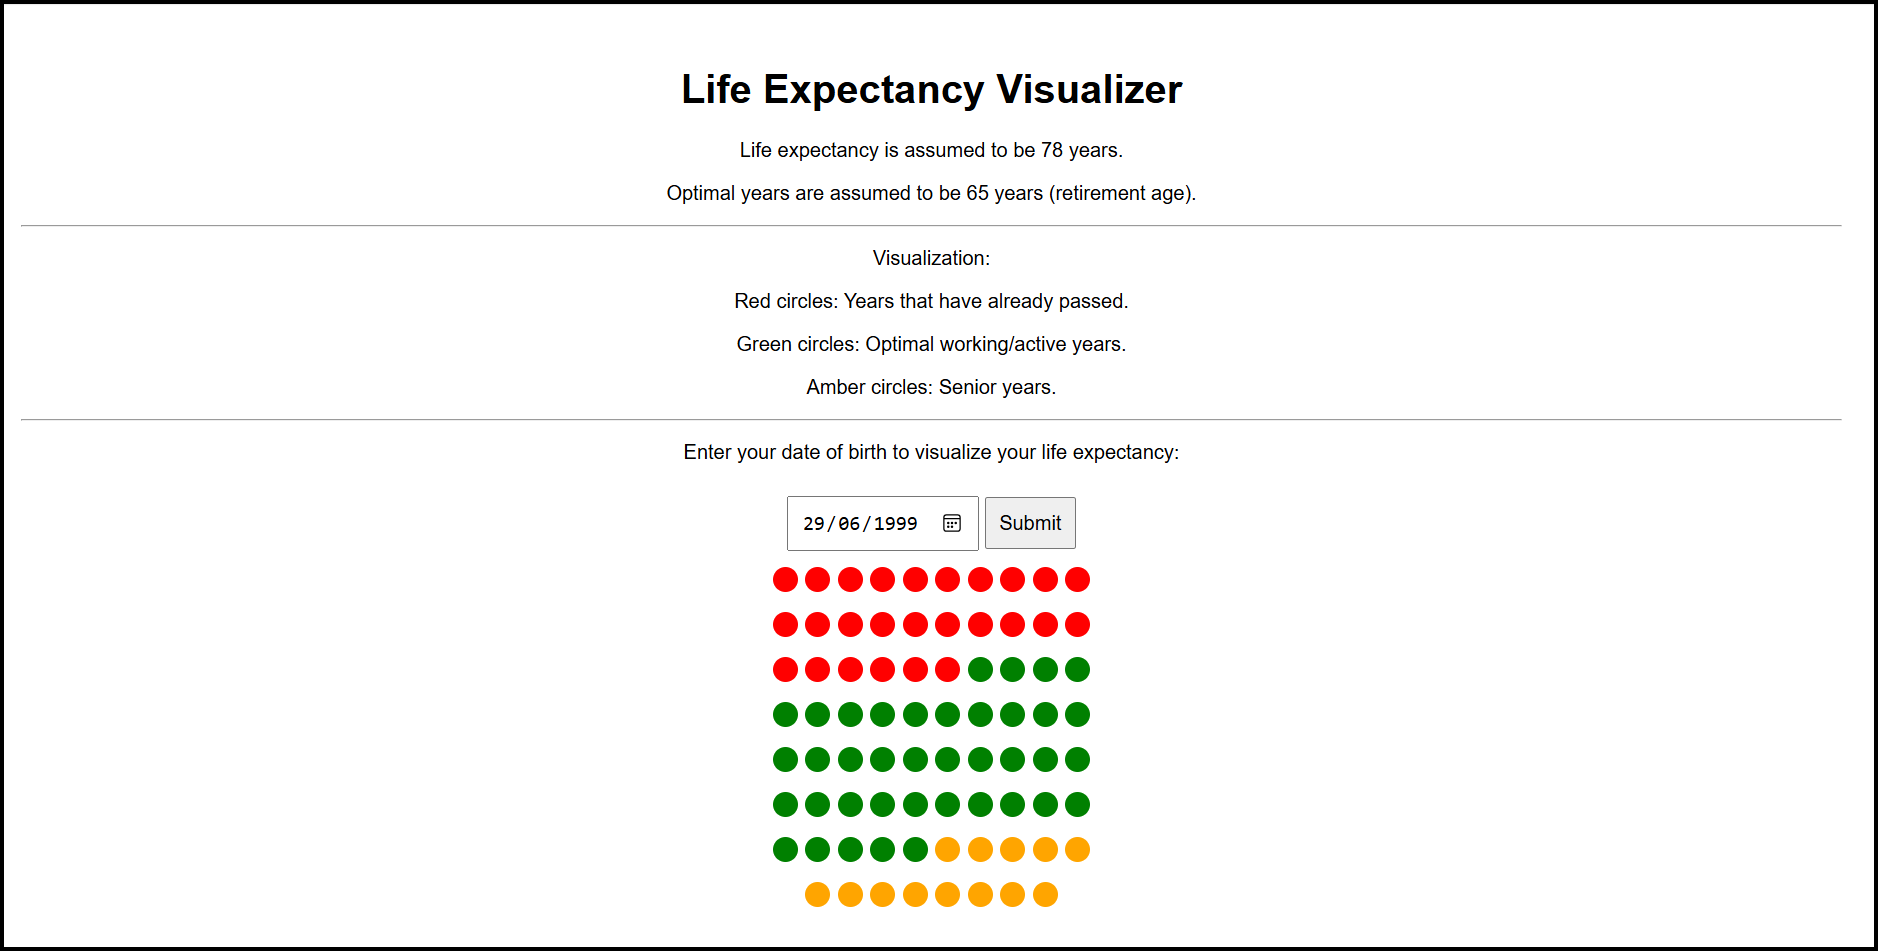
Building a Life Expectancy Visualizer with GPT-4o in Minutes
The author reflects on their birthday and time passing, then describes building a life expectancy visualizer web tool using GPT-4o in under

ggsql: Grammar of Graphics Implementation for SQL Visualization
ggsql is a new tool that implements the grammar of graphics (like ggplot2) using SQL syntax, allowing users to create data visualizations di
 opensource.posit.co·1mo ago
MDV: A Markdown Superset for Documents, Dashboards, and Slides with Embedded Data Visualizations
MDV is a Markdown superset that extends CommonMark with four key additions for creating documents, dashboards, and slides with embedded data
 github.com·1mo ago
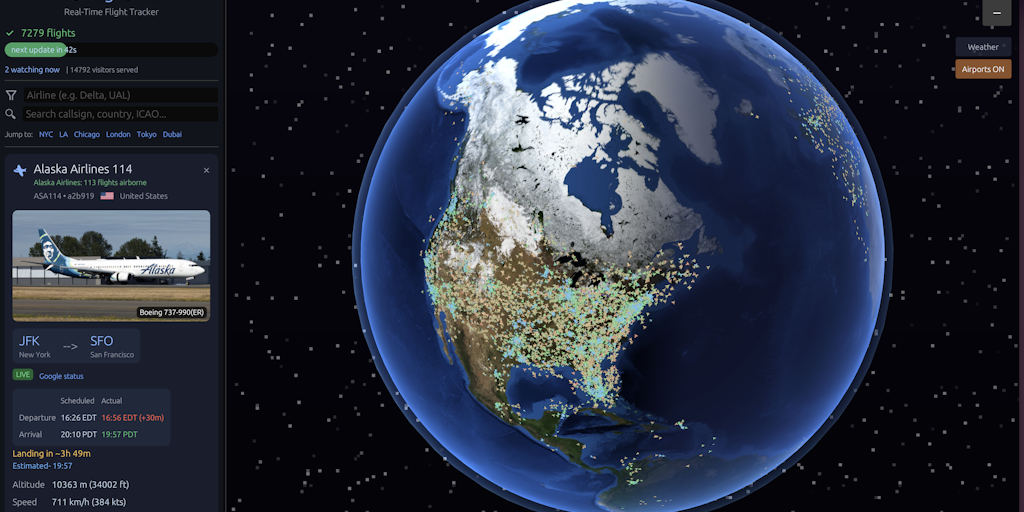
Flight Viz: Real-Time 3D Flight Tracking with 10,000+ Aircraft on Interactive Globe
Flight Viz is a web-based 3D flight tracking tool that displays over 10,000 live aircraft on an interactive globe with real-time data, weath
 Product Hunt·1mo ago
Shaper: Open-Source SQL-Powered Data Visualization Tool Using DuckDB
Shaper is an open-source, SQL-driven data visualization and dashboard tool powered by DuckDB. It allows users to build analytics dashboards
github.com·3mo agoAnalysis of ATProto Key Management Issues and Account Recovery Problems
The author recounts their experience with ATProto's key management system, where they lost access to their account due to a key rotation iss