Tracking AI Model Performance Degradation: Arena Elo History Visualization
By
mayerwin
Toasted just enough. A reliable bake, gently seasoned.
Summary
This article presents a visualization tool that tracks the Elo ratings of flagship AI models over time on the Arena AI Leaderboard. It explains that AI labs frequently update models post-launch, leading users to report perceived "nerfs" such as excessive quantization, aggressive censorship, or behavioral degradation. The chart plots each model's public Elo lifecycle on a single timeline to make such trends visible. Data is fetched daily from the official Arena AI Leaderboard Dataset on Hugging Face, which is built from thousands of blind, crowdsourced head-to-head human votes, though the author acknowledges this measurement method is imperfect.
Key quotes
· 4 pulledAI labs frequently update their models post-launch, and users regularly report perceived 'nerfs': excessive quantization (to save compute costs), aggressive censorship, or behavioral degradation.
This chart plots each flagship's public Elo lifecycle on one timeline, so any such trend would be visible at a glance.
Data is fetched daily from the official Arena AI Leaderboard Dataset on Hugging Face, built from thousands of blind, crowdsourced head-to-head human votes.
It's an imperfect lens
You might also wanna read

ZDNET launches AI Model Release Tracker to contextualize new model releases against competitors
ZDNET's AI Model Release Tracker provides context for evaluating new AI models, emphasizing that not every release is a major breakthrough d
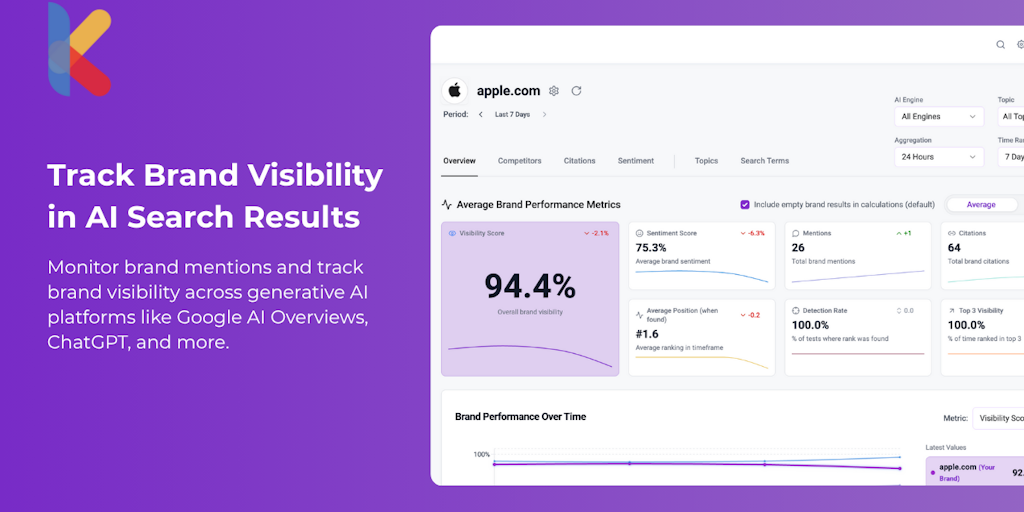
AI Brand Visibility Tracker for Monitoring Mentions in Generative AI Platforms
The article describes an AI rank tracker tool that monitors brand visibility across generative AI platforms like Google AI Overviews and Cha
 Product Hunt·11mo ago
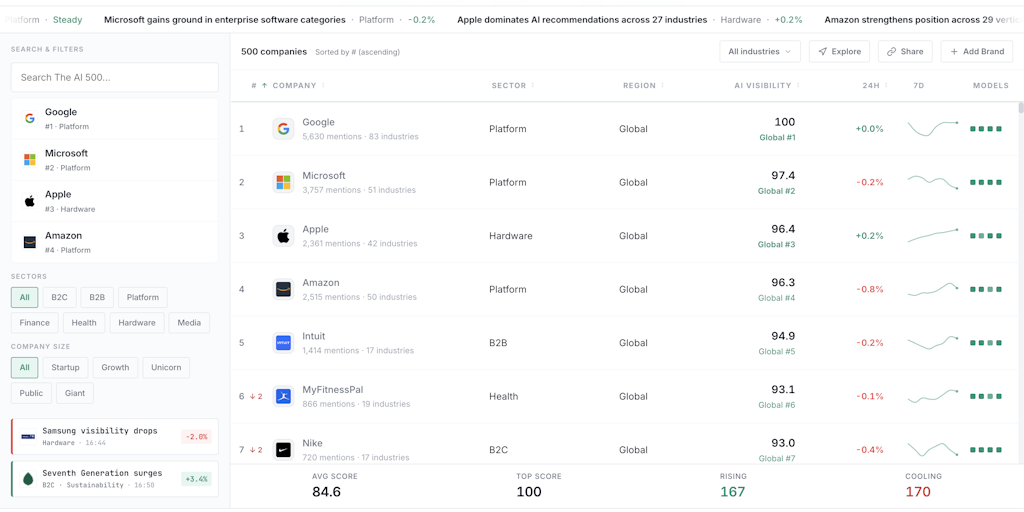
AI 500: Public Benchmark Tracking Brand Visibility Across Major AI Models
The article introduces the AI 500, a public benchmark tracking AI brand visibility across major AI models (ChatGPT, Claude, Gemini, Perplexi
Product Hunt·5mo ago