Workers - Investigate your Workers with the Query Builder in the new Observability dashboard
1y ago
Source
CloudflareWorkers - Investigate your Workers with the Query Builder in the new Observability dashboardcloudflare.comThe Workers Observability dashboard offers a single place to investigate and explore your Workers Logs . The Overview tab shows logs from all your Workers in one place. The Invocations view groups logs together by invocation, which refers to the specific trigger that started the execution of the Worker (i.e. fetch). The Events view shows logs in the order they were produced, based on timestamp. Previously, you could only view logs for a single Worker. The Investigate tab presents a Query Builder, which helps you write structured queries to investigate and visualize your logs. The Query Builder can help answer questions such as: Which paths are experiencing the most 5XX errors? What is the wall time distribution by status code for my Worker? What are the slowest requests, and where are they coming from? Who are my top N users? The Query Builder can use any field that you store in your logs as a key to visualize, filter, and group by. Use the Query Builder to quickly access your data, build visualizations, save queries, and share them with your team. Workers Logs is now Generally Available Workers Logs is now Generally Available. With a small change to your Wrangler configuration, Workers Logs ingests, indexes, and stores all logs emitted from your Workers for up to 7 days. We've introduced a number of changes during our beta period, including: Dashboard enhancements with customizable fields as columns in the Logs view and support for invocation-based grouping Performance improvements to ensure no adverse impact Public API endpoints for broader consumption The API documents three endpoints: list the keys in the telemetry dataset, run a query, and list the unique values for a key. For more, visit our REST API documentation . Visit the docs to learn more about the capabilities and methods exposed by the Query Builder. Start using Workers Logs and the Query Builder today by enabling observability for your Workers: wrangler.jsonc { " observability " : { " enabled " : true , " logs " : { " invocation_logs " : true , " head_sampling_rate " : 1 // optional. default = 1. } } } wrangler.toml [ observability ] enabled = true [ observability . logs ] invocation_logs = true head_sampling_rate = 1
You might also wanna read

The Fundamental Flaws in Traditional Logging and the Case for Wide Events in Observability
The article critiques traditional logging practices in software development, arguing that conventional logs are fundamentally flawed and ins
 loggingsucks.com·6mo ago
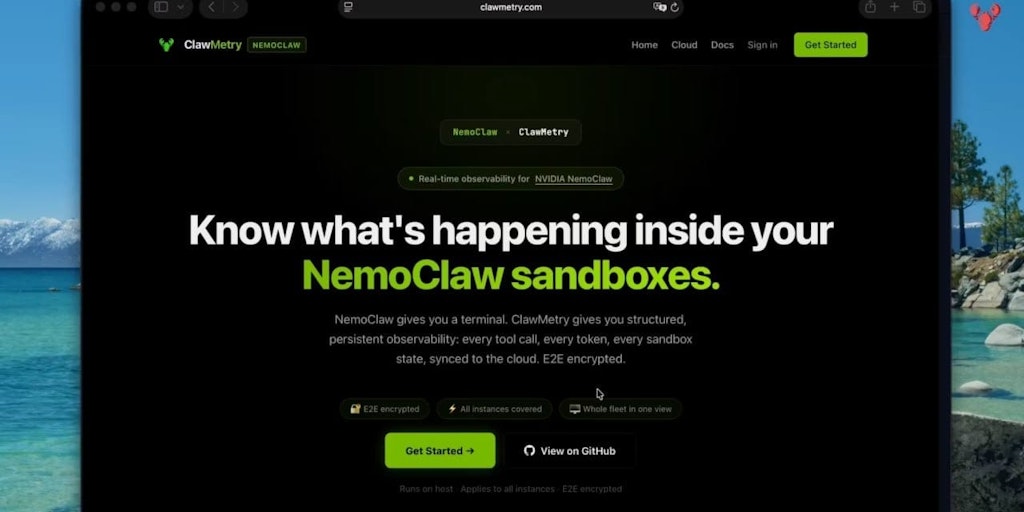
ClawMetry: Open-Source Observability Dashboard for OpenClaw AI Agents
ClawMetry is a free, open-source observability dashboard specifically designed for OpenClaw AI agents, offering real-time monitoring capabil
 Product Hunt·3mo ago
Observability Industry Critique: The Unanswered Question About Data Waste
The article is a critical reflection on the observability industry after a decade of experience. The author, who founded Timber.io (which be

Observability's Evolution: A Historical Perspective on Developer Tooling Challenges
The author reflects on their frustration with current observability tools and workflows, examining the field through a historical lens of pa
 blog.sherwoodcallaway.com·6mo ago
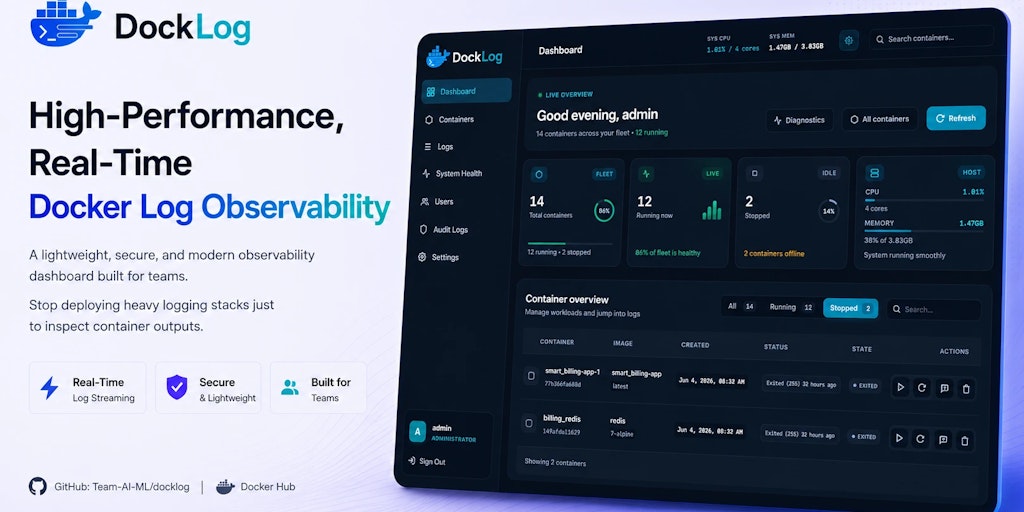
DockLog: A Self-Hosted Docker Observability Platform for Real-Time Container Monitoring
DockLog is a self-hosted Docker observability platform that allows developers, DevOps teams, and homelab enthusiasts to monitor containers i
Product Hunt·24d ago
Comments
Sign in to join the conversation.
No comments yet. Be the first.