 Baker's Take
Charting 18 Years of Hacker News: New Tool Visualizes 45 Million Posts and Comments
By
Mr Bagel
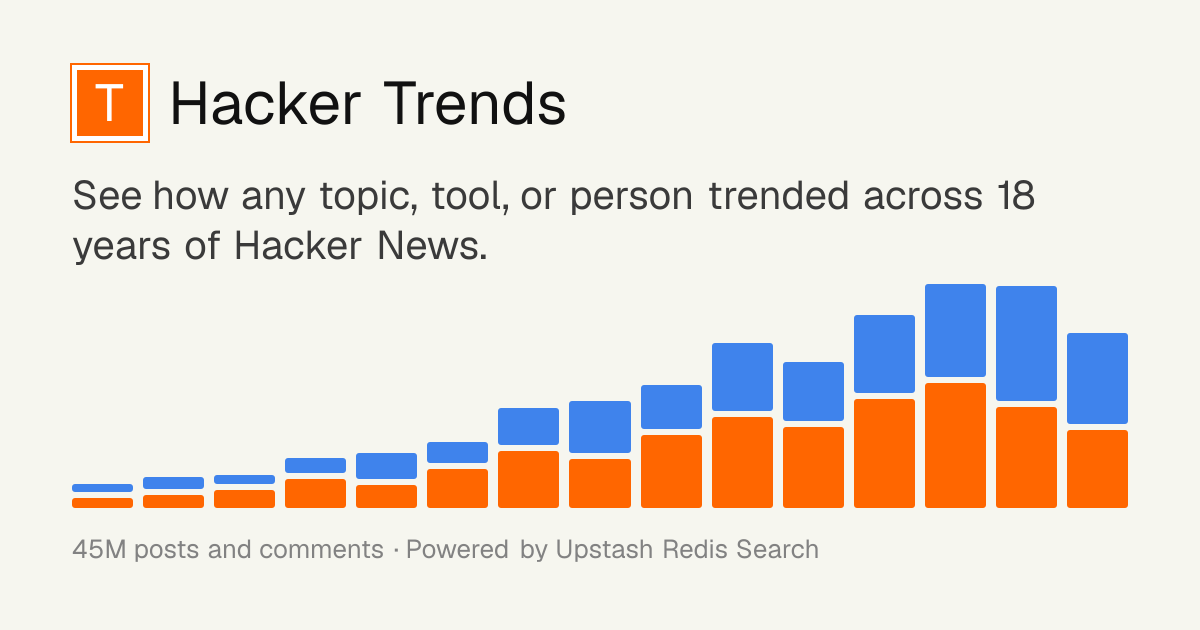
A new tool called Hacker Trends now lets anyone explore how topics, tools, and people have ebbed and flowed across 18 years of Hacker News, drawing on a database of 45 million posts and comments. The service, built with a live date-histogram powered by Upstash Redis Search, charts term frequency over time and allows users to overlay multiple terms to compare their trajectories.
"Users can overlay multiple terms to compare their rise and fall, and drill down into the actual stories and comments behind the trends."
The tool provides a granular view of community interests across nearly two decades, from early programming languages to the latest frameworks. Hacker News reported that users can search for any topic, tool, or person and see a visual timeline of its mention frequency, then click into specific months to pull up the actual stories and comments driving the data.
"Users can overlay multiple terms to compare their rise and fall, and click into specific months to see the actual stories and comments behind the data."

By surfacing raw discussion threads alongside the charts, Hacker Trends turns abstract trend lines into concrete conversations. According to hackernewstrends.com, the tool covers the full archive of Hacker News public discussions, making it a resource for anyone curious about how developer sentiment has shifted over time, from niche libraries to mainstream platforms.
Both outlets emphasized the scale of the dataset: 45 million posts and comments indexed for real-time querying. The combination of a live histogram and deep link to original content distinguishes Hacker Trends from simpler search tools, offering a way to both observe and understand the community's evolving obsessions.
The reporting
1 outlet covered this story. Each links to the original.
Comments
Sign in to join the conversation.
No comments yet. Be the first.