
























Modeling a digital twin of a food supply chain using BigQuery Graph
By
Candice Chen
1mo agoen
Source
Google NewsModeling a digital twin of a food supply chain using BigQuery Graphgoogle.comThe example of a growing restaurant Imagine you are running a restaurant chain. You just can't physically feel and touch things to know how your business operates. You need tools and a digital replica of your business to sense the health of the business for you. The friction of growth Growth creates a unique kind of friction that spreadsheets simply weren't built to solve: The bullwhip effect: Small downstream demand shifts swell into upstream inventory tidal waves. SOP drift: Tiny departures from standard prep work eventually erode the entire brand vibe. The food safety blast radius: One contaminated ingredient creates a messy, complex map of risk across the network. Maverick spend: The "million-dollar leak" caused by local managers purchasing ingredients off-contract. The digital twin Digital models empower us to ask more insightful questions about the world, but they also force a critical choice in how we structure data. While traditional relational tables have been the standard, we must ask: are they still the right tool for everything? Given that our world is inherently interconnected, perhaps shifting to graph-based models is the natural evolution for capturing reality. When managing thousands of assets, complex supply chains, or global logistics networks, traditional relational databases require massive, resource-intensive SQL joins to trace dependencies. This architecture creates a latency gap between physical events and operational awareness. Modeling with BigQuery Graph BigQuery Graph allows you to build a digital twin of your entire supply chain within your existing data platform. By turning your physical world—items, recipes, and locations—into a searchable map of nodes and edges, you gain a new level of clarity. 1. Defining the Semantic Layer Instead of moving data to a new database, you create a Graph View over your existing tables. This tells BigQuery exactly how your tables relate to one another. Query Language: code_block )])]> Image of a fictitious restaurant supply chain modeled using BigQuery Graph Precision in practice How does this change daily operations? It moves the business from panic to precision. Surgical recalls: If a supplier reports a Listeria breakout, you walk the graph forward to find exactly which menu items in which specific restaurants are affected. Weather risk analysis: When a hurricane threatens a distribution center, you don't see a list of stores; you see the blast radius. You identify the locations critically dependent on that hub and reroute supplies. 2. Executing the search Graph Queries are a new tool for modelers and data scientists to query their data - it simplifies complex multi-domain data concepts and simplifies querying and makes data analysis a simpler more natural representation of problem articulation. For example: If I want to know which all locations handle chicken I could run a graph query as shown below: To investigate a specific complaint or risk, you run a search on the model using graph query language. Graph Query Language code_block (b:itemlocation) \r\nWHERE b.itemKey LIKE '%Chicken%'\r\nRETURN to_json([to_json(a),to_json(c),to_json(b)]) as result"), ('language', ''), ('caption', )])]> Source of a foul odor - modeled as a graph Building for the future To get the most out of your digital twin, follow these guiding principles: Focus on structure: Use graphs for relationships and dependencies; keep daily sales totals in relational tables. Clean your keys: Spend time on data engineering; a graph is only as strong as its connections. Capture edge properties: Store metadata like lead times or shipping costs directly on the edges to increase the model's utility. Conclusion The restaurant industry has outgrown the relational way of treating business data only as a list. By building inter-domain relationships as a digital twin with BigQuery Graph, you move from reactive problem solving to proactive modeling. It’s time to stop managing your network with a list and start seeing the connections in seconds. Get started today Check out the tutorial here Visit the BigQuery documentation: find overview and quickstart guide . Share your feedback: join our community , and get your questions answered via [email protected] . Related blog: Introducing BigQuery Graph
You might also wanna read

The Visual Imperative in B2B Marketing: Balancing Data-Driven Metrics with Scalable Creativity
This article argues that B2B marketing has become overly reliant on data, spreadsheets, and metrics (MQLs, SQLs, lead scoring) at the expens
 agilebrandguide.com·1mo ago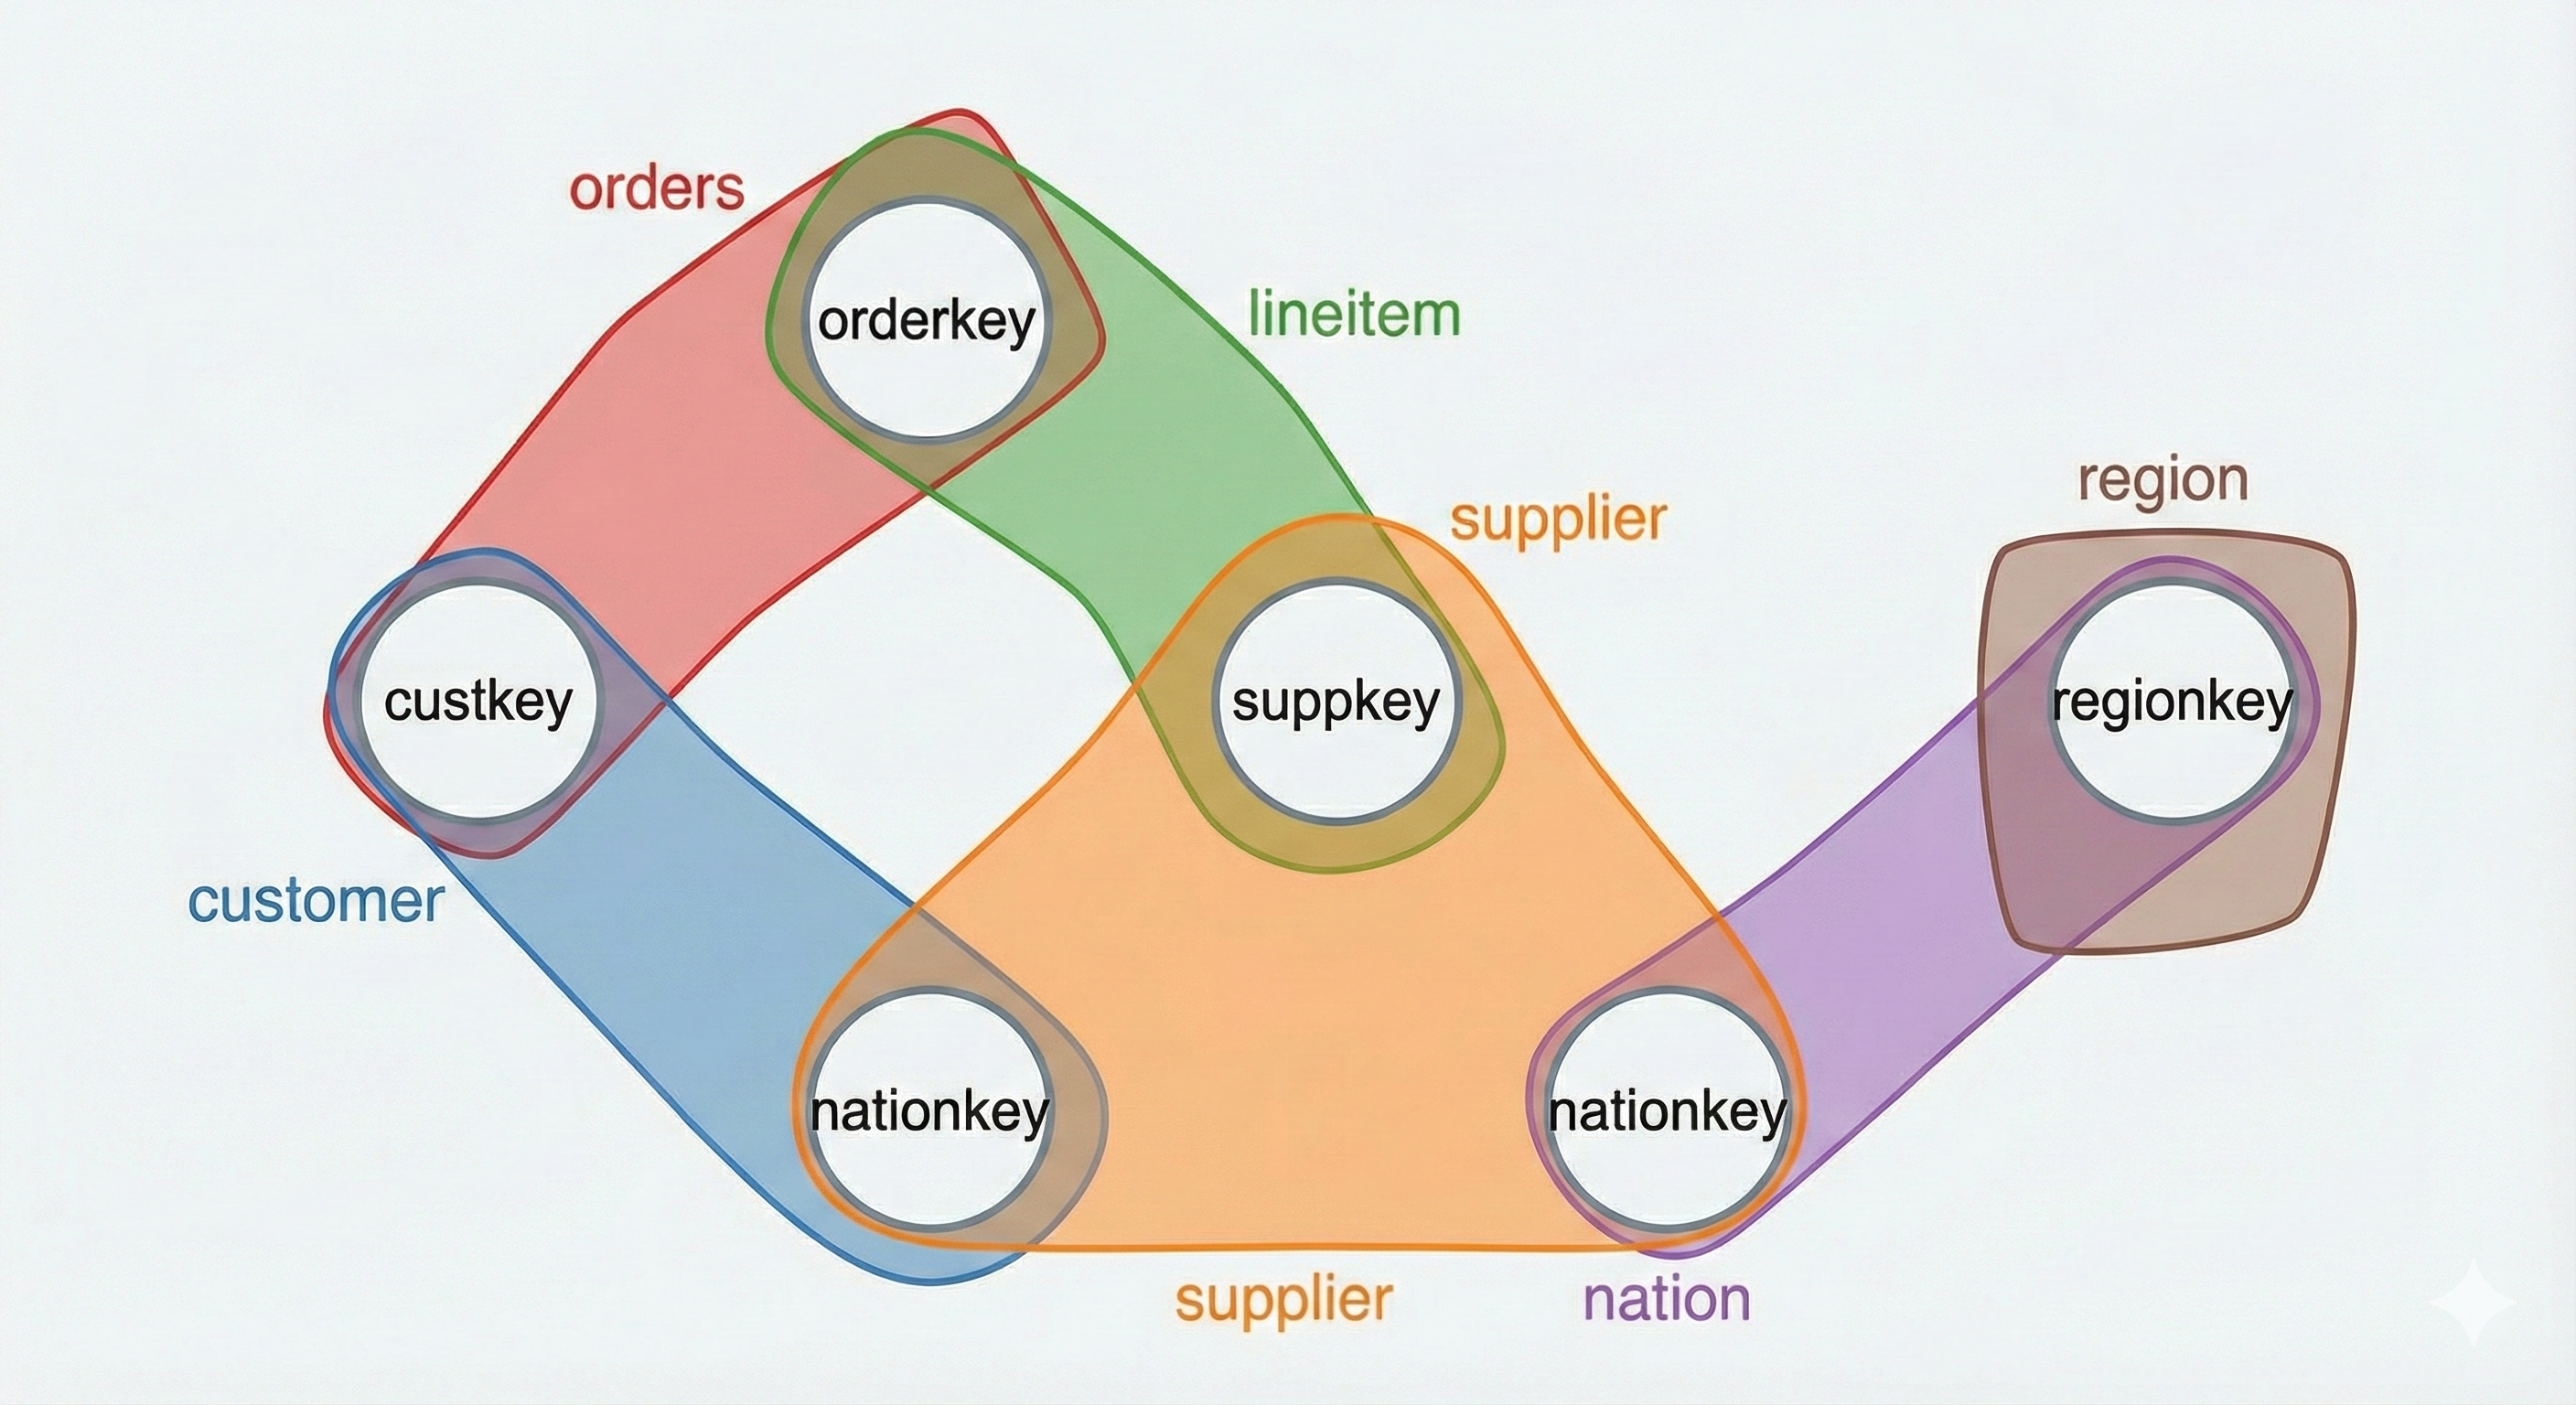
Graph Theory Approach to Worst Case Optimal Joins in Database Query Processing
This article introduces the concept of Worst Case Optimal Joins through the lens of graph theory, using TPC-H Query 5 (Local Supplier Volume
 finnvolkel.com·6mo ago
GraphQL in Enterprise: When Complexity Outweighs Benefits
The article presents a critical perspective on GraphQL adoption in enterprise environments based on real-world production experience. The au
 johnjames.blog·6mo ago
Legacy Warehouses to Open Lakehouses: A Step-by-Step Migration Playbook
iceberglakehouse.com·1mo ago

Conceptual, Logical, and Physical Data Models Explained
datalakehousehub.com·4mo ago

The Cascade Graph: A Knowledge Graph of Physical and Geopolitical Economic Constraints
AtomProphet's "The Cascade Graph" is an interactive knowledge graph mapping how physical and geopolitical constraints drive structural stres
 atomprophet.io·15d ago
Comments
Sign in to join the conversation.
No comments yet. Be the first.