Workers - Workers now supports JavaScript debug terminals in VSCode, Cursor and Windsurf IDEs
1y ago
Source
CloudflareWorkers - Workers now supports JavaScript debug terminals in VSCode, Cursor and Windsurf IDEscloudflare.comWorkers now support breakpoint debugging using VSCode's built-in JavaScript Debug Terminals . All you have to do is open a JS debug terminal ( Cmd + Shift + P and then type javascript debug ) and run wrangler dev (or vite dev ) from within the debug terminal. VSCode will automatically connect to your running Worker (even if you're running multiple Workers at once!) and start a debugging session. In 2023 we announced breakpoint debugging support for Workers, which meant that you could easily debug your Worker code in Wrangler's built-in devtools (accessible via the [d] hotkey) as well as multiple other devtools clients, including VSCode . For most developers, breakpoint debugging via VSCode is the most natural flow, but until now it's required manually configuring a launch.json file , running wrangler dev , and connecting via VSCode's built-in debugger. Now it's much more seamless!
You might also wanna read

Open-Source Tool Provides Interactive Web Terminal for Debugging Failed GitHub Actions
The article presents a free, open-source tool that enables developers to launch an interactive web terminal into their GitHub Actions when b

The Case for Terminal-Based Development Over GUI IDEs Like VS Code
The article argues that developers should move away from Visual Studio Code and other GUI-based IDEs to terminal-based development for bette
 jrswab.com·6mo ago
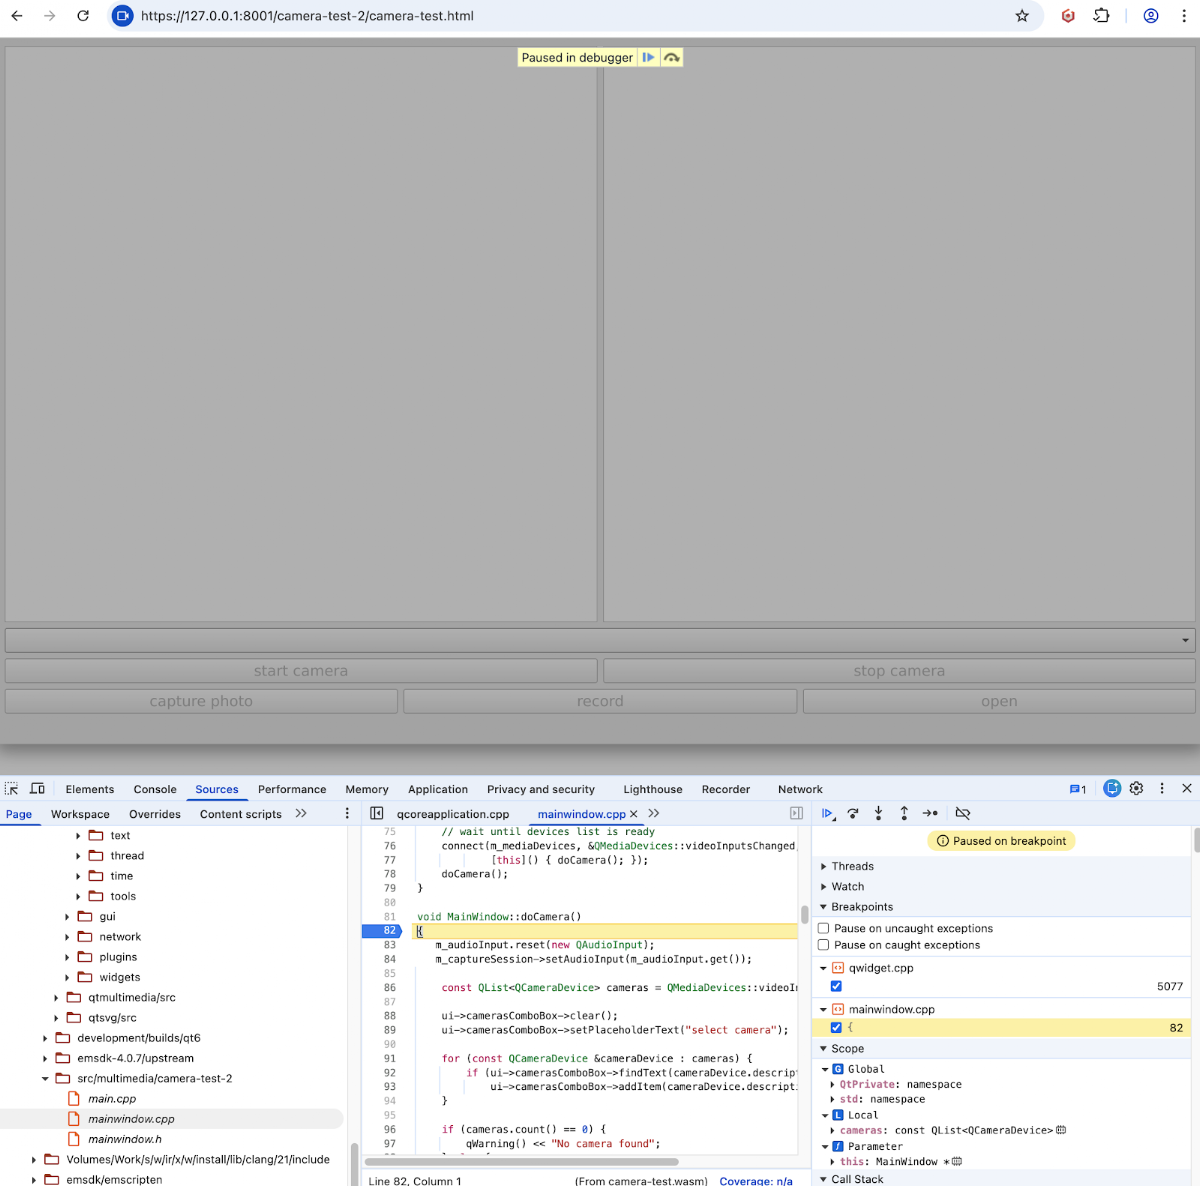
Debugging Qt WebAssembly Applications with DWARF Symbols
This article provides technical guidance on debugging Qt WebAssembly applications using DWARF debugging symbols. It explains that debugging
 qtandeverything.blogspot.com·6mo ago
Chrome DevTools MCP Server Update Enables Coding Agents to Debug Active Browser Sessions
Chrome DevTools MCP server now allows coding agents to directly connect to active browser sessions, enabling them to reuse existing sessions
 developer.chrome.com·3mo ago
Effective Debugging Techniques for TypeScript Web Applications
This article promotes a book about debugging TypeScript applications, focusing on making web development more efficient by reducing bugs and
pragprog.com·6mo ago
Comments
Sign in to join the conversation.
No comments yet. Be the first.