Introduction to Nomograms and the pyNomo Documentation
By
Eridanus2
Summary
This documentation introduces the concept of nomograms (nomographs) — graphical diagrams that allow calculation of mathematical formulas by using numbered scales and a straightedge. It explains that nomograms are useful for formulas involving three or more variables, providing an alternative to traditional graphs which only handle two variables. The content serves as an introductory section for the pyNomo software documentation, which is a Python library for creating nomograms.
Source
 Hacker NewsIntroduction to Nomograms and the pyNomo Documentationlefakkomies.github.io
Key quotes
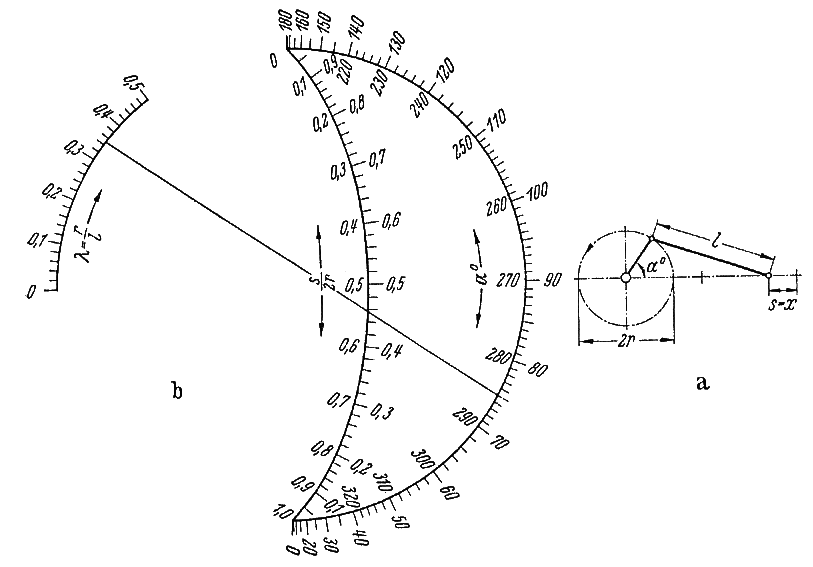
· 3 pulledA nomogram or nomograph is a diagram that provides an easy, graphical way of calculating the result of a mathematical formula.
Sometimes also called an alignment chart, a nomogram consists of a set of numbered scales, usually one for each variable in the formula, arranged so that a straightedge can be placed across known values to find the unknown value that solves the formula.
Since an equation in two variables is usually represented by a graph, most nomograms represent formulas that involve three or more variables.
You might also wanna read

NoDocs: Visual No-Code Documentation Builder for Product Documentation
NoDocs is a no-code documentation builder that enables users to create, manage, and publish product documentation visually without coding. I
 Product Hunt·10mo ago
Polygram: AI-native app builder that plans and designs before coding
Polygram is an AI-native design and coding app that introduces a structured workflow (Plan → Design → Build) for creating mobile and web app
 Product Hunt·14d ago
StoryMotion: Tool for Creating Animated Diagrams and Flowcharts with Hand-Drawn Style
StoryMotion is a tool that enables users to easily create animated diagrams and flowcharts with a hand-drawn aesthetic. The platform allows
Product Hunt·7mo ago
ChartDB: Open-Source Tool for Visual Database Schema Diagrams
ChartDB is a free, open-source tool that instantly converts database schemas into editable ER diagrams with a single query. Designed for dev
Product Hunt·10mo ago
Noxionite: Open-Source Blog Engine for Notion Pages
Noxionite is a free, open-source blog engine that transforms Notion pages into beautiful, fast websites. Built on react-notion-x, it feature
Product Hunt·9mo ago
Ideogram 4.0: Open-Weight AI Model for Design-Ready Images with Layout Control
Ideogram 4.0 is an open-weight text-to-image AI model trained from scratch on structured JSON captions, designed for design-oriented outputs
Product Hunt·22d ago
Comments
Sign in to join the conversation.
No comments yet. Be the first.