
























SPYI vs. JEPI: Which Monthly ‘Paycheck’ ETF Actually Wins When the Market Gets Ugly?
The NEOS S&P 500 High Income ETF (BATS:SPYI) crossed roughly $10 billion in assets under management in June. That makes it one of the largest derivative-income vehicles in the US and forces a real…
Read the full articleYou might also wanna read

JEPI's Low Expense Ratio Masks a 14.48% Annual Return Gap vs. SPY Due to Options Strategy and Tax Inefficiency
JEPI’s low expense ratio understates total cost because option-based upside is surrendered and distributions are taxed as ordinary income.
 briefly.co·23d ago
JEPQ's 9-Point Performance Gap vs QQQ: The Real Cost of Monthly Income from Nasdaq-100 Covered-Call ETF
JEPQ markets premium income on the Nasdaq-100 but has underperformed its underlying benchmark by about nine percentage points over the past
briefly.co·23d ago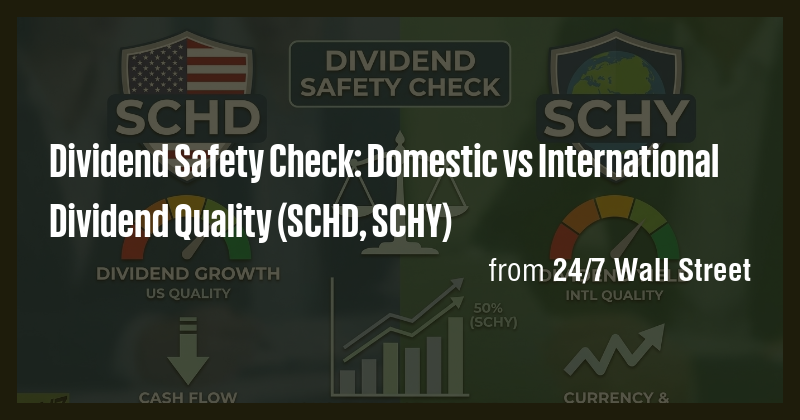
Dividend ETF Comparison: SCHD (U.S.) vs SCHY (International) Quality Screens and Distributions
SCHD tracks a Dow Jones U.S. dividend index built from companies with 10 years of consecutive dividend payments, then ranks them using cash-
briefly.co·27d agoInvesco Pharmaceuticals ETF vs State Street Biotech ETF: Which Fund Is the Better Buy in 2026?
PJP delivers lower volatility and higher income with concentrated pharma exposure, while XBI offers broader biotech growth at lower cost.

Vanguard S&P 500 ETF (VOO) Nears $1 Trillion, Poised to Become First ETF to Reach the Milestone
The ETF currently sits at $980 billion in AUM.
 etf.com·1mo ago
ETF Edge on what’s led to the historic bounce of small cap ETFs
Small caps have been having a banner year, with the Russell 2000 outperforming the S&P 500 year-to-date. Some small-cap focused ETFs have al
Comments
Sign in to join the conversation.
No comments yet. Be the first.