Security Center - Cloudforce One Threat events graphs are now visible in the dashboard
4mo ago
Source
CloudflareSecurity Center - Cloudforce One Threat events graphs are now visible in the dashboardcloudflare.comWe have introduced dynamic visualizations to the Threat Events dashboard to help you better understand the threat landscape and identify emerging patterns at a glance. What's new: Sankey Diagrams : Trace the flow of attacks from country of origin to target country to identify which regions are being hit hardest and where the threat infrastructure resides. Dataset Distribution over time : Instantly pivot your view to understand if a specific campaign is targeting your sector or if it is a broad-spectrum commodity attack. Enhanced Filtering : Use these visual tools to filter and drill down into specific attack vectors directly from the charts. Cloudforce One subscribers can explore these new views now in Application Security > Threat Intelligence > Threat Events .
You might also wanna read

Early Exploitation of React2Shell Vulnerability (CVE-2025-55182) Targets Critical Infrastructure
The article details early exploitation activity following the public disclosure of the critical React2Shell vulnerability (CVE-2025-55182).
 blog.cloudflare.com·6mo ago
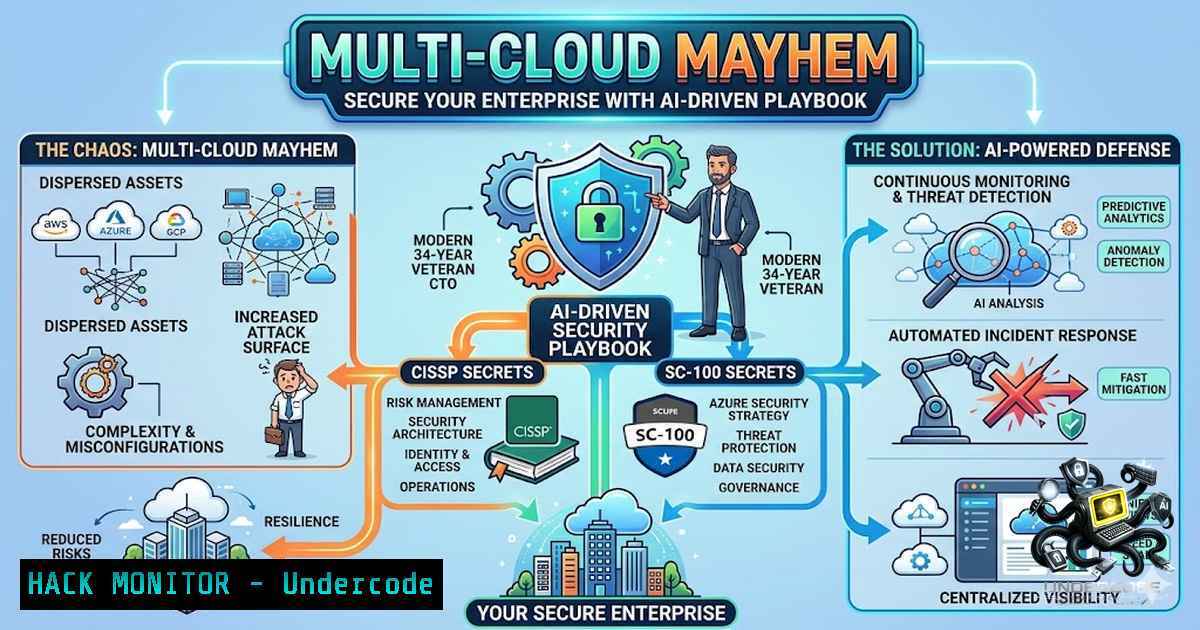
Multi-Cloud Security Challenges: AI-Driven Threat Detection and Unified Security Fabrics for AWS, Azure, and GCP
This article discusses multi-cloud security challenges as enterprises adopt AWS, Azure, and GCP alongside AI technologies. It features Shahz
 undercodetesting.com·12d ago
SIEM Explained: How Security Information and Event Management Platforms Empower Blue Teams
This article explores Security Information and Event Management (SIEM) platforms as the central nervous system of modern cybersecurity opera
undercodetesting.com·5d ago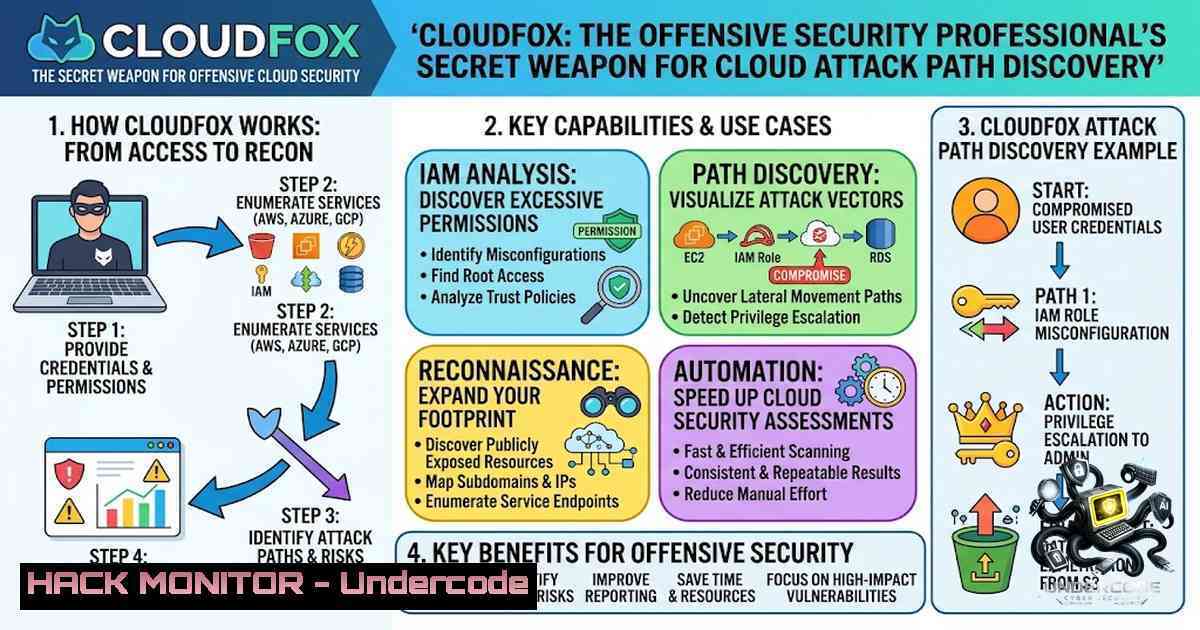
CloudFox: An Open-Source Tool for Cloud Attack Path Discovery in AWS, Azure, and GCP
CloudFox is an open-source command-line tool developed by Bishop Fox that helps offensive security professionals (penetration testers and re
undercodetesting.com·17d ago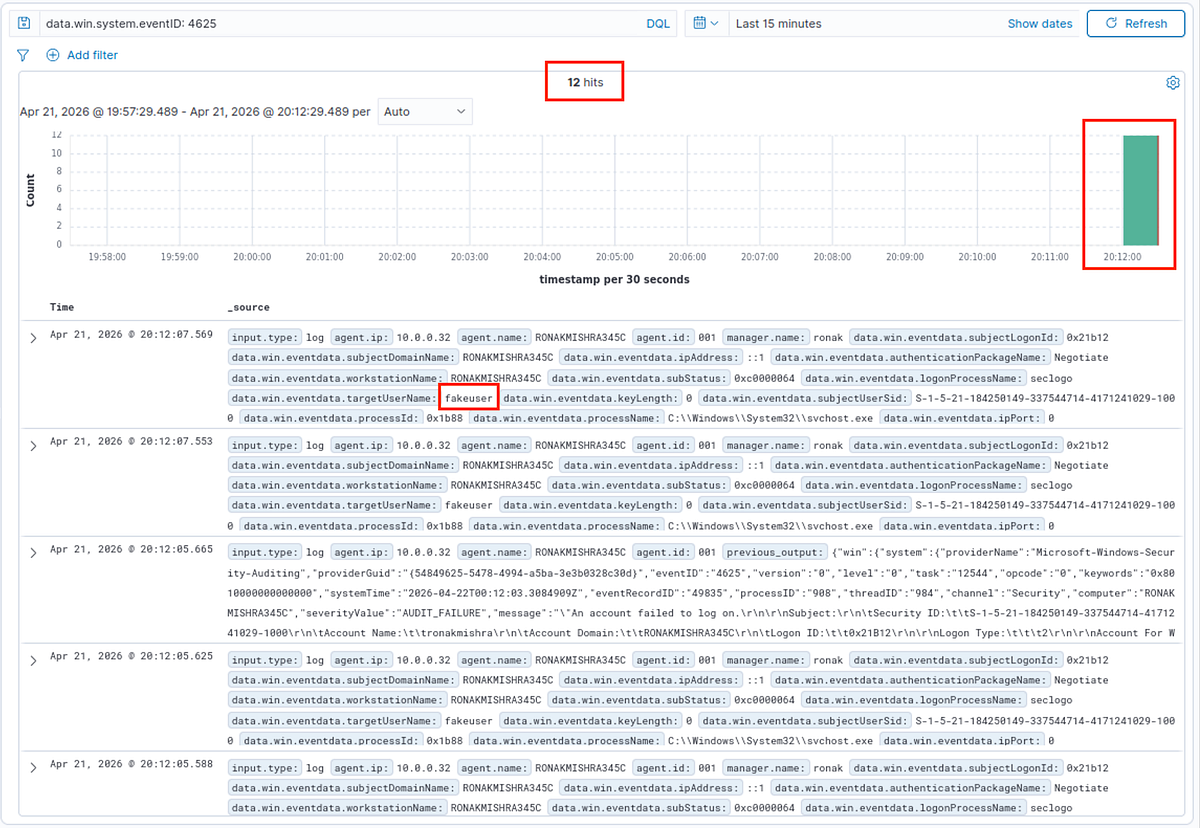
5 Critical Windows Event IDs for SOC Analysts: A Hands-On SIEM Lab Demonstration
This article provides a practical, hands-on guide for SOC analysts on five critical Windows Event IDs (4624, 4625, 4672, 4688, 4648) that in
 infosecwriteups.com·1mo ago
Comments
Sign in to join the conversation.
No comments yet. Be the first.