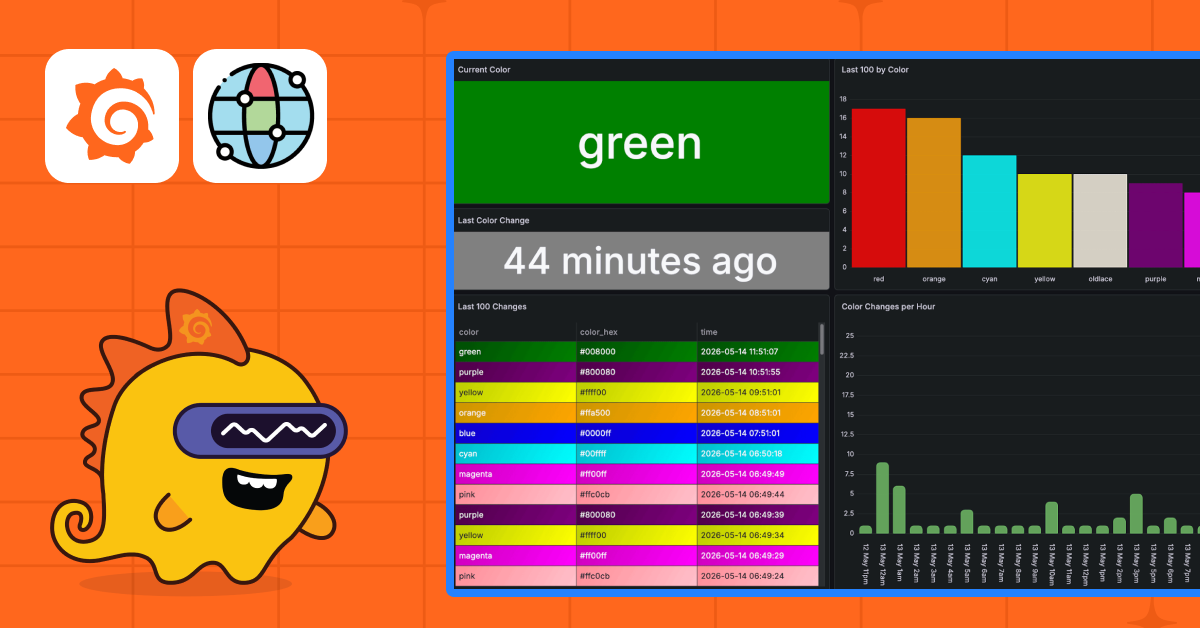
How to visualize CheerLights IoT data in Grafana Cloud using the Infinity data source
By
Simon Prickett
Summary
This article is a tutorial-style guide from a Grafana Labs Developer Advocate explaining how to create colorful, data-driven dashboards in Grafana Cloud by visualizing CheerLights data. CheerLights is an IoT-based system that changes color based on global sentiment. The author walks through using the CheerLights JSON feed and the Infinity data source to build interactive, real-time visualizations. The piece combines personal learning journey narrative with practical step-by-step technical instructions for Grafana users.
Source
 bskyHow to visualize CheerLights IoT data in Grafana Cloud using the Infinity data sourcemedium.com
Key quotes
· 3 pulledWhen I first joined the Developer Advocacy team here at Grafana Labs, I spent a lot of my time exploring ways to accelerate my Grafana learning journey.
My introduction to the open source project happened when I needed a way to easily visualize data that resided in external databases, mostly using SQL queries.
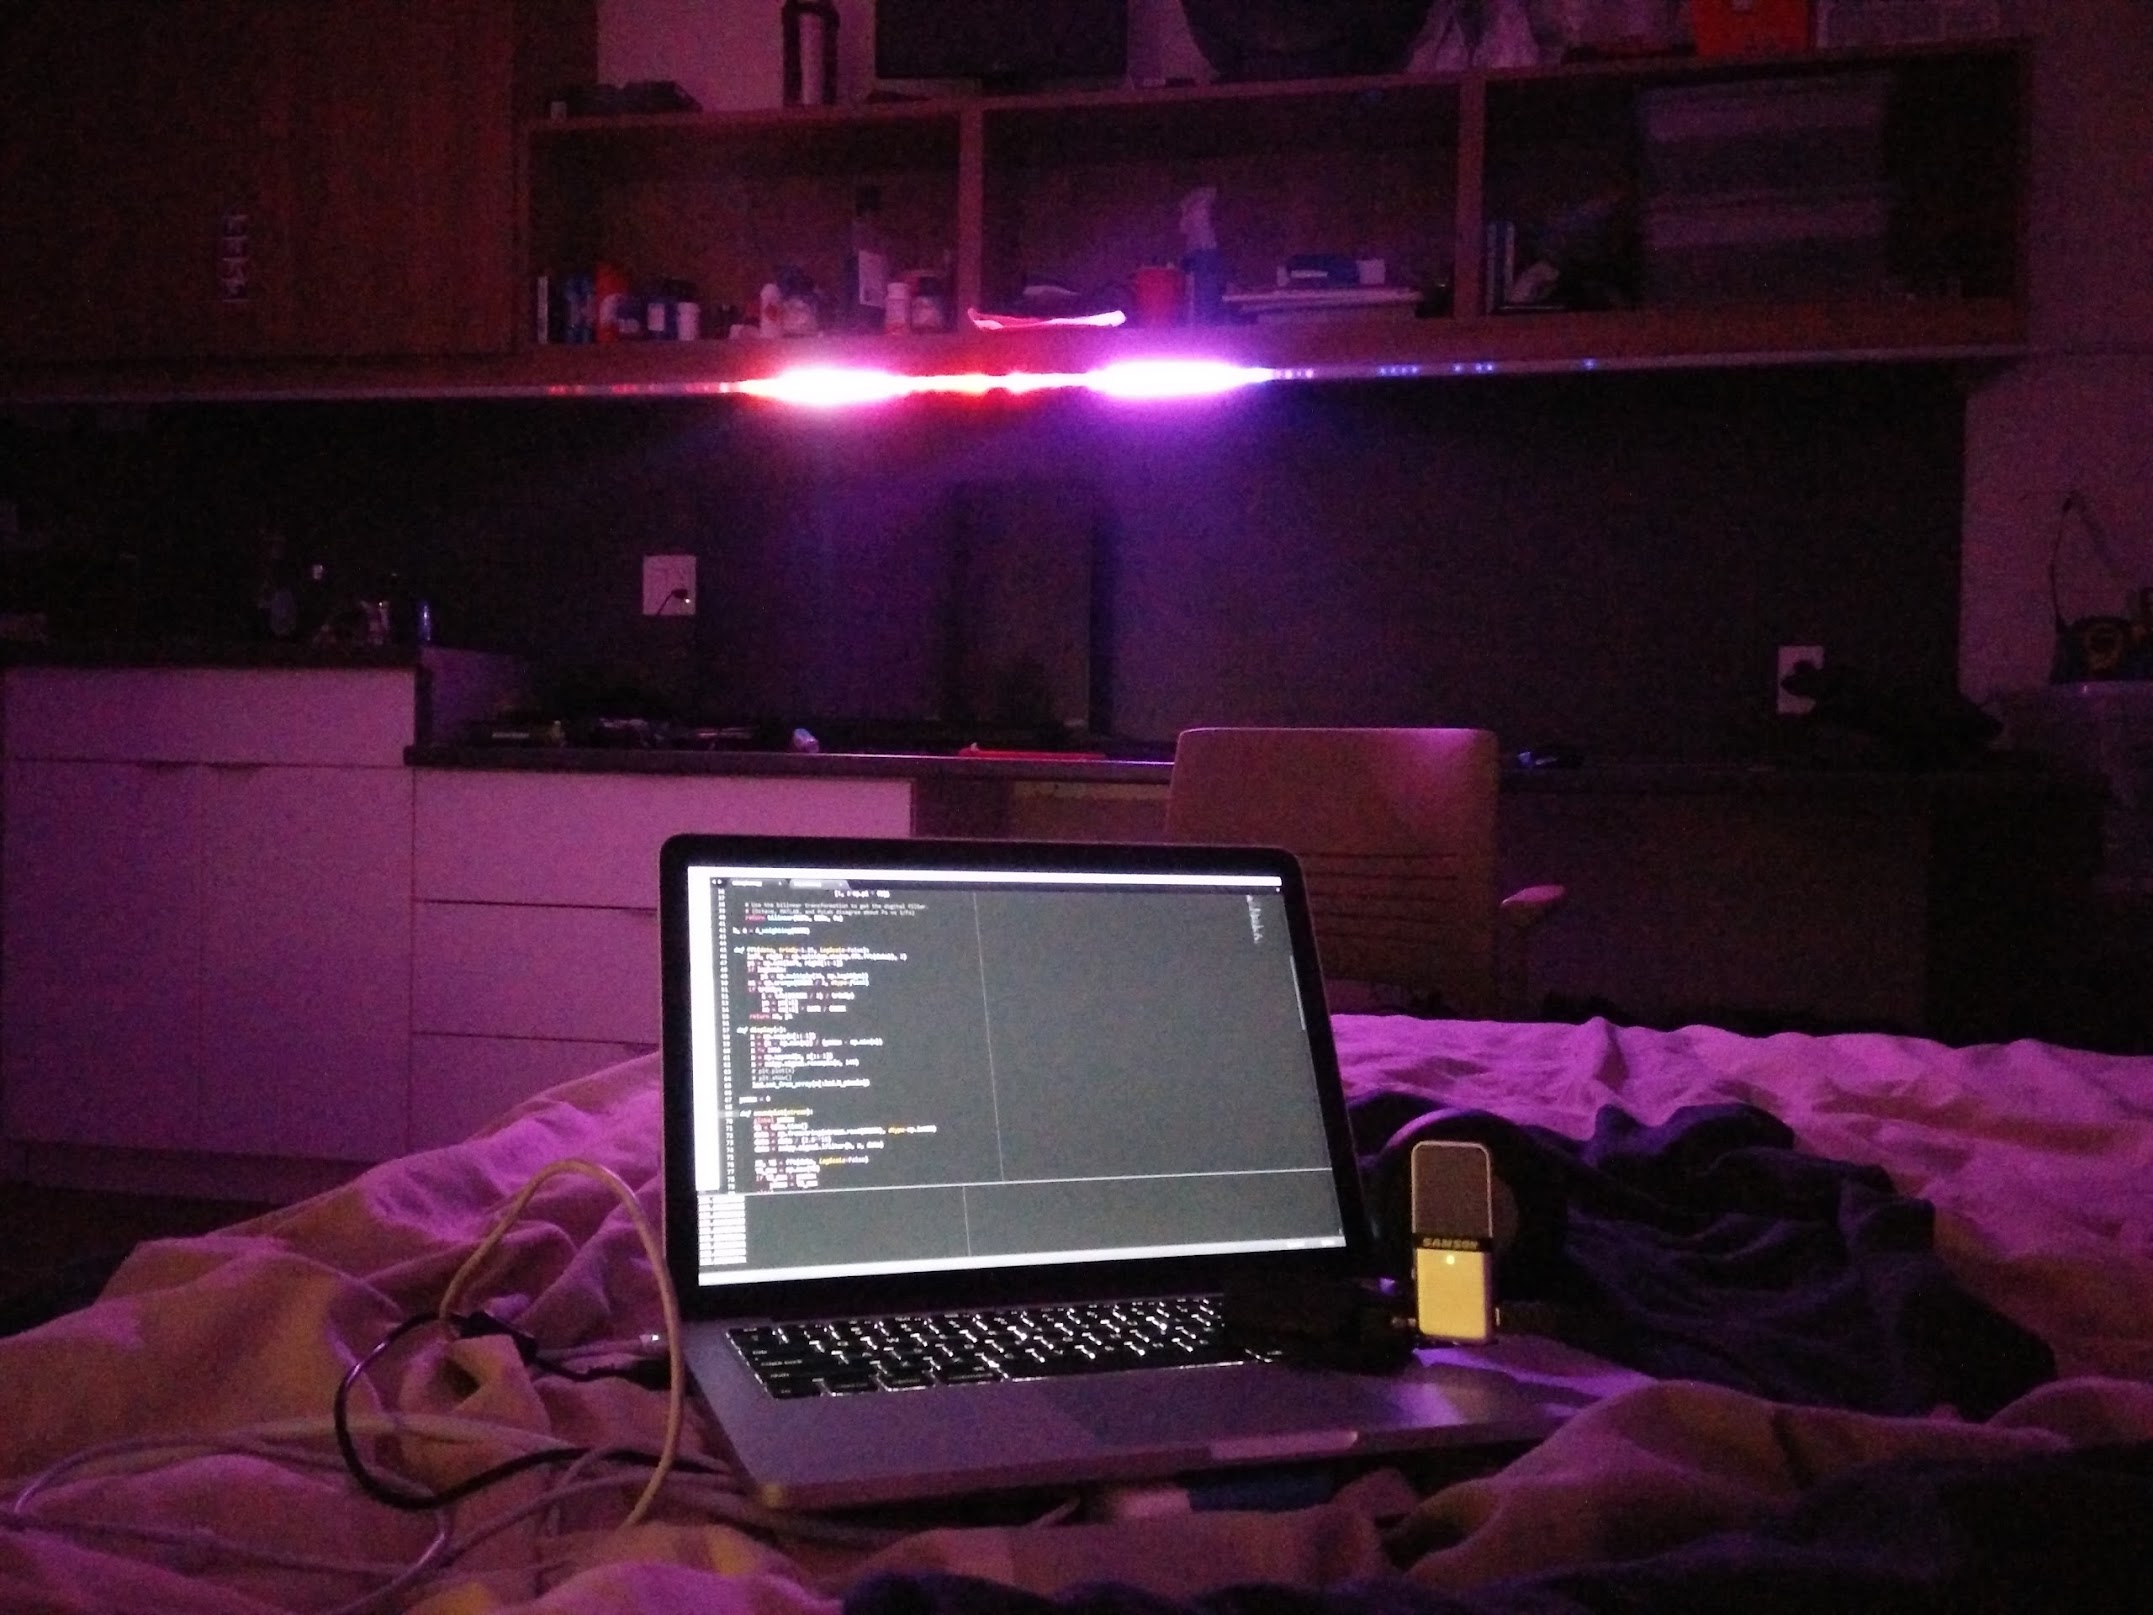
One of my long-time personal interests outside of work is experimenting with Internet of Things (IoT) devices.
You might also wanna read

A Decade-Long Journey Building an Audio-Reactive LED Strip Visualizer Project
The article details the author's decade-long journey creating an audio-reactive LED strip project that started as a simple idea in 2016 and
Infinite: Open-source local analytics unification tool for GA4, PostHog, Meta, and Stripe data
Infinite is an open-source tool that unifies analytics data from platforms like GA4, PostHog, Meta, and Stripe into a local database on the
 Product Hunt·10d ago
Using CUE Schemas to Unify IoT Sensor Data in Home Automation
The article details the author's experience building a home automation system using CUE (Configure, Unify, Execute) schemas to handle divers
 aran.dev·8mo ago
Understanding D3.js Verbosity: Why the Data Visualization Library Requires Detailed Code
The article explores why D3.js, a JavaScript library for data visualization, appears verbose and complex to beginners. The author, currently

Practical Guide to Real-Time Analytics Data Modeling with ClickHouse
This comprehensive guide provides practical strategies for implementing real-time analytics using ClickHouse, focusing on data modeling tech
 ssp.sh·9mo ago
OrangeLabs: AI-Powered Data Analysis Platform for Teams
OrangeLabs is an AI-powered data analysis platform that enables teams to analyze, interpret, and visualize complex data without requiring co
Product Hunt·4mo ago
Comments
Sign in to join the conversation.
No comments yet. Be the first.