
























David Lieb on Understanding User Behavior with Dot Plots
David Lieb from Y Combinator explains how dot plots offer deeper insights into user behavior than aggregate metrics alone.
Read the full articleYou might also wanna read


Real-Time Agentic Analytics with ClickHouse
> **Cross-posted.** This article's canonical home is [Data Lakehouse Hub](
iceberglakehouse.com·1mo ago

Rethinking Tufte's data-to-ink ratio: When minimalism in data visualization goes too far
How much minimalism is too much minimalism? I explore this question and propose the most minimalist, highest scoring data-to-ink ratio on a
 frank.computer·1mo ago
Anatomy of an Agentic Analytics System: Inside the Multi-Step Reasoning Loop
> **Cross-posted.** This article's canonical home is [Data Lakehouse Hub](
iceberglakehouse.com·1mo ago
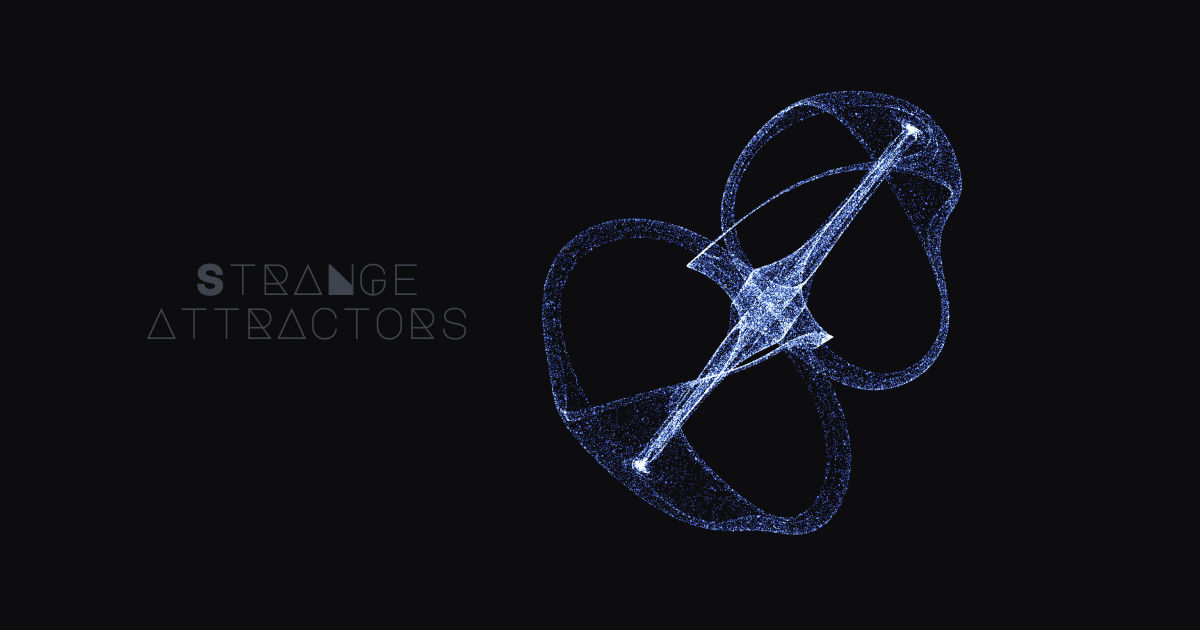
Exploring Strange Attractors and Chaos Theory with Three.js Visualizations
A visualisation of Strange Attractors using a Threejs particle system. In this post, I will try to explain the basics of dynamical systems,
 blog.shashanktomar.com·8mo ago
Comparing the Top 2026 Agentic Analytics Tools: ThoughtSpot, Databricks, and Tableau
> **Cross-posted.** This article's canonical home is [Data Lakehouse Hub](
iceberglakehouse.com·1mo ago

The Rise of Agentic Analytics: Shifting BI from Passive Dashboards to Goal-Directed Action
> **Cross-posted.** This article's canonical home is [Data Lakehouse Hub]( # ...
iceberglakehouse.com·1mo ago
Comments
Sign in to join the conversation.
No comments yet. Be the first.