The Monitoring Blind Spot: Why Green Dashboards Don't Mean Your System Is Working
By
Mrinal Narang
Summary
This article discusses the critical gap between infrastructure monitoring (CPU, memory, disk usage) and actual system functionality. It highlights how traditional monitoring tools like Prometheus can show all systems as "healthy" while the service is broken from a user perspective (e.g., customers can't log in or payments fail). The piece argues that organizations need to shift from monitoring internal infrastructure metrics to monitoring real user-facing functionality and business outcomes.
Source
 bskyThe Monitoring Blind Spot: Why Green Dashboards Don't Mean Your System Is Workingcstu.io
Key quotes
· 3 pulledA healthy system is not the same as a working system.
Dashboards are all green. CPU is fine. Memory looks good. Pods aren't restarting. Databases are healthy. But customers can't log in, or payments won't process, or nothing's loading.
You check Prometheus. Nothing's firing. Everything says 'we're fine.' Except you're not fine.
You might also wanna read

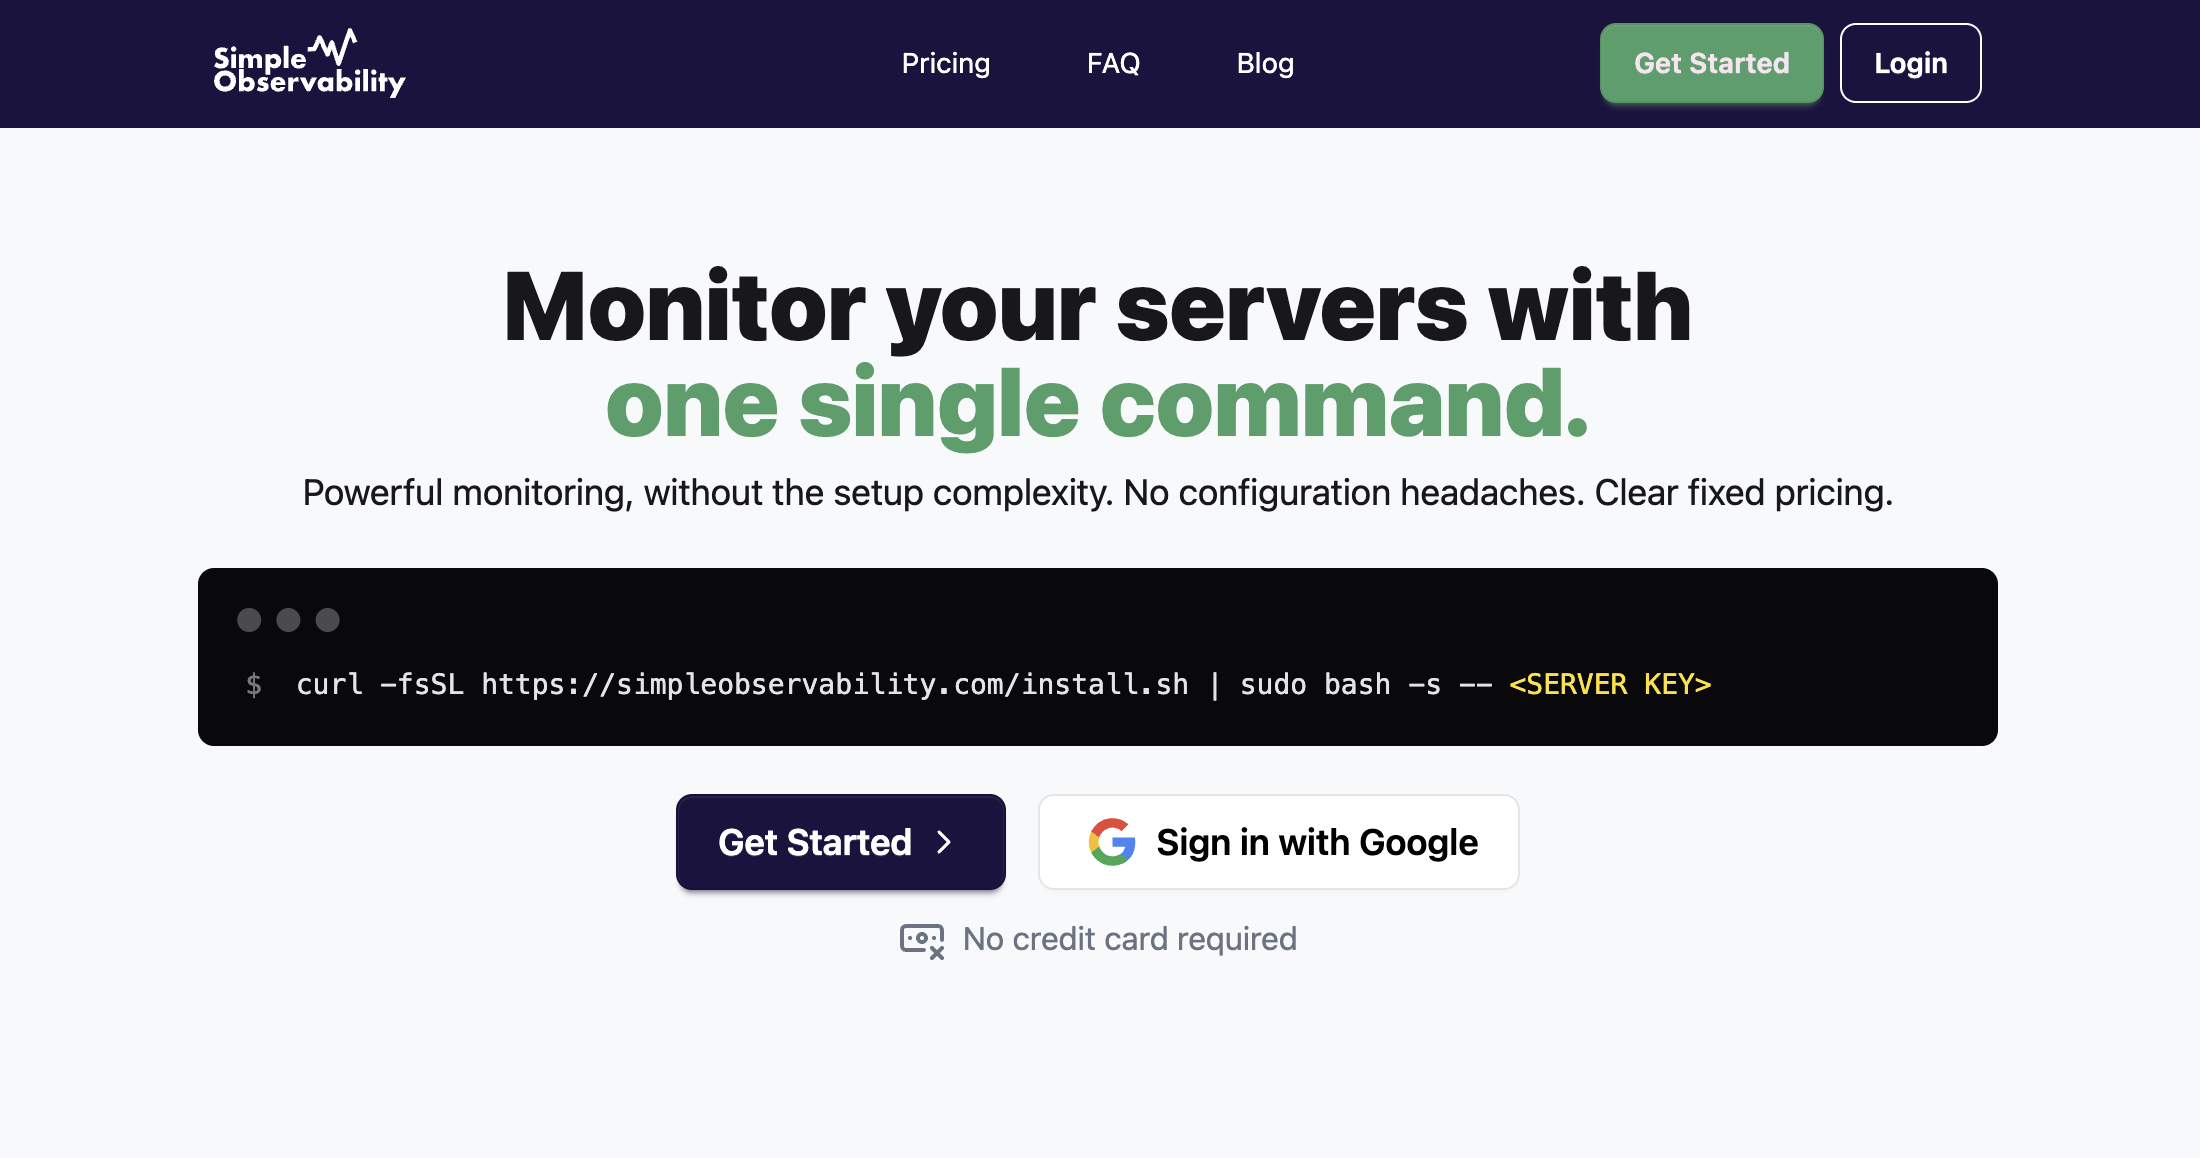
Why alerts, not dashboards, are the foundation of effective infrastructure monitoring
This article argues that alerts, not dashboards, are the true core of infrastructure monitoring. While teams often focus on building dashboa
 simpleobservability.com·1mo ago
AWS Health Dashboard: Monitoring Service Status and Health Across AWS Infrastructure
The article discusses the AWS Health Dashboard, a tool that provides real-time visibility into the status and health of AWS services. It ena
health.aws.amazon.com·3mo ago
Health Checking in Load Balancing: Client-Side vs Server-Side Approaches and Failure Detection
The article examines health checking mechanisms in load balancing systems, comparing client-side versus server-side approaches. It explains
 singh-sanjay.com·4mo ago
Debugging a Disappearing Service Processor in Oxide's Next-Gen Rack
Oxide Computer Company describes a challenging debugging scenario where their Service Processor (SP) would disappear from the management net
 oxide.computer·24d ago
AWS Health Dashboard: Monitoring AWS Service Status and Health
The article provides information about the AWS Health Dashboard, which allows users to monitor the status and health of AWS services. It ser
health.aws.amazon.com·8mo ago
Canonical and Ubuntu Status Dashboard - Service Monitoring Page
This page is a status monitoring dashboard for Canonical and Ubuntu services. It displays a cookie consent banner and provides information a
status.canonical.com·1mo agoComments
Sign in to join the conversation.
No comments yet. Be the first.