Analysis of Google Street View Coverage Patterns and Geospatial Data Trends
Benchmarks & Tips for Big Data, Hadoop, AWS, Google Cloud, PostgreSQL, Spark, Python & More...
Read the full articleYou might also wanna read


Window View: Free Tool to See Building Views on Google Earth
Ever shown up to an apartment only to find the "city view" is a brick wall? Window View lets you step inside any building on Google Earth an
 Product Hunt·4mo ago
Laari Futures: Mapping 78 street vending typologies as mobile urban infrastructure across India
the laari futures project extends chaal chaal agency's research documenting 78 street vending typologies across 12 indian cities.
Laari Futures: Mapping 78 street vending typologies as mobile urban infrastructure across India
the laari futures project extends chaal chaal agency's research documenting 78 street vending typologies across 12 indian cities.
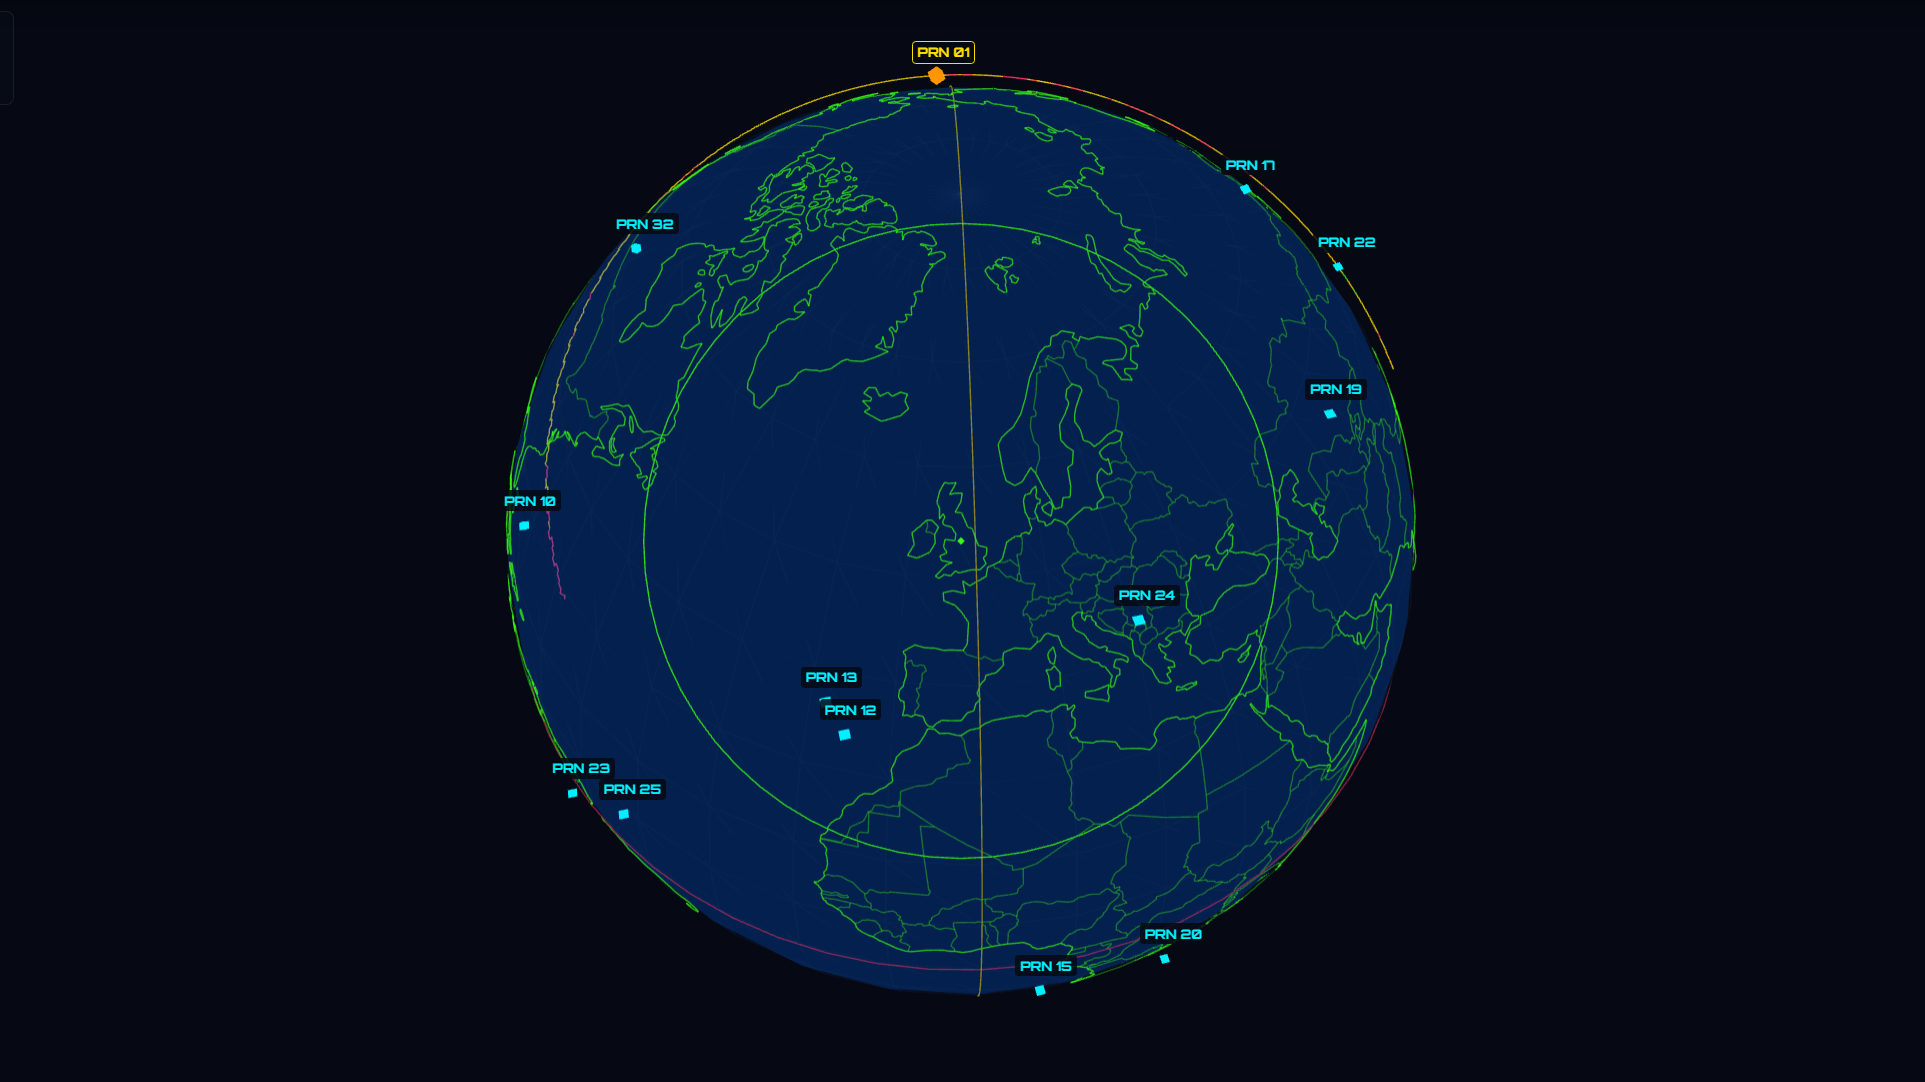
Browser-Based 3D Visualizer Shows Real-Time GPS Satellite Positions
Billions of people use GPS on a daily basis, along with the various other satellite navigation systems available today. But few of us spend
 hackaday.com·26d ago
ShowYourStripes: Visualizing Climate Change Across Every Country
Visualising how the climate has changed for every country across the globe
 showyourstripes.info·26d ago
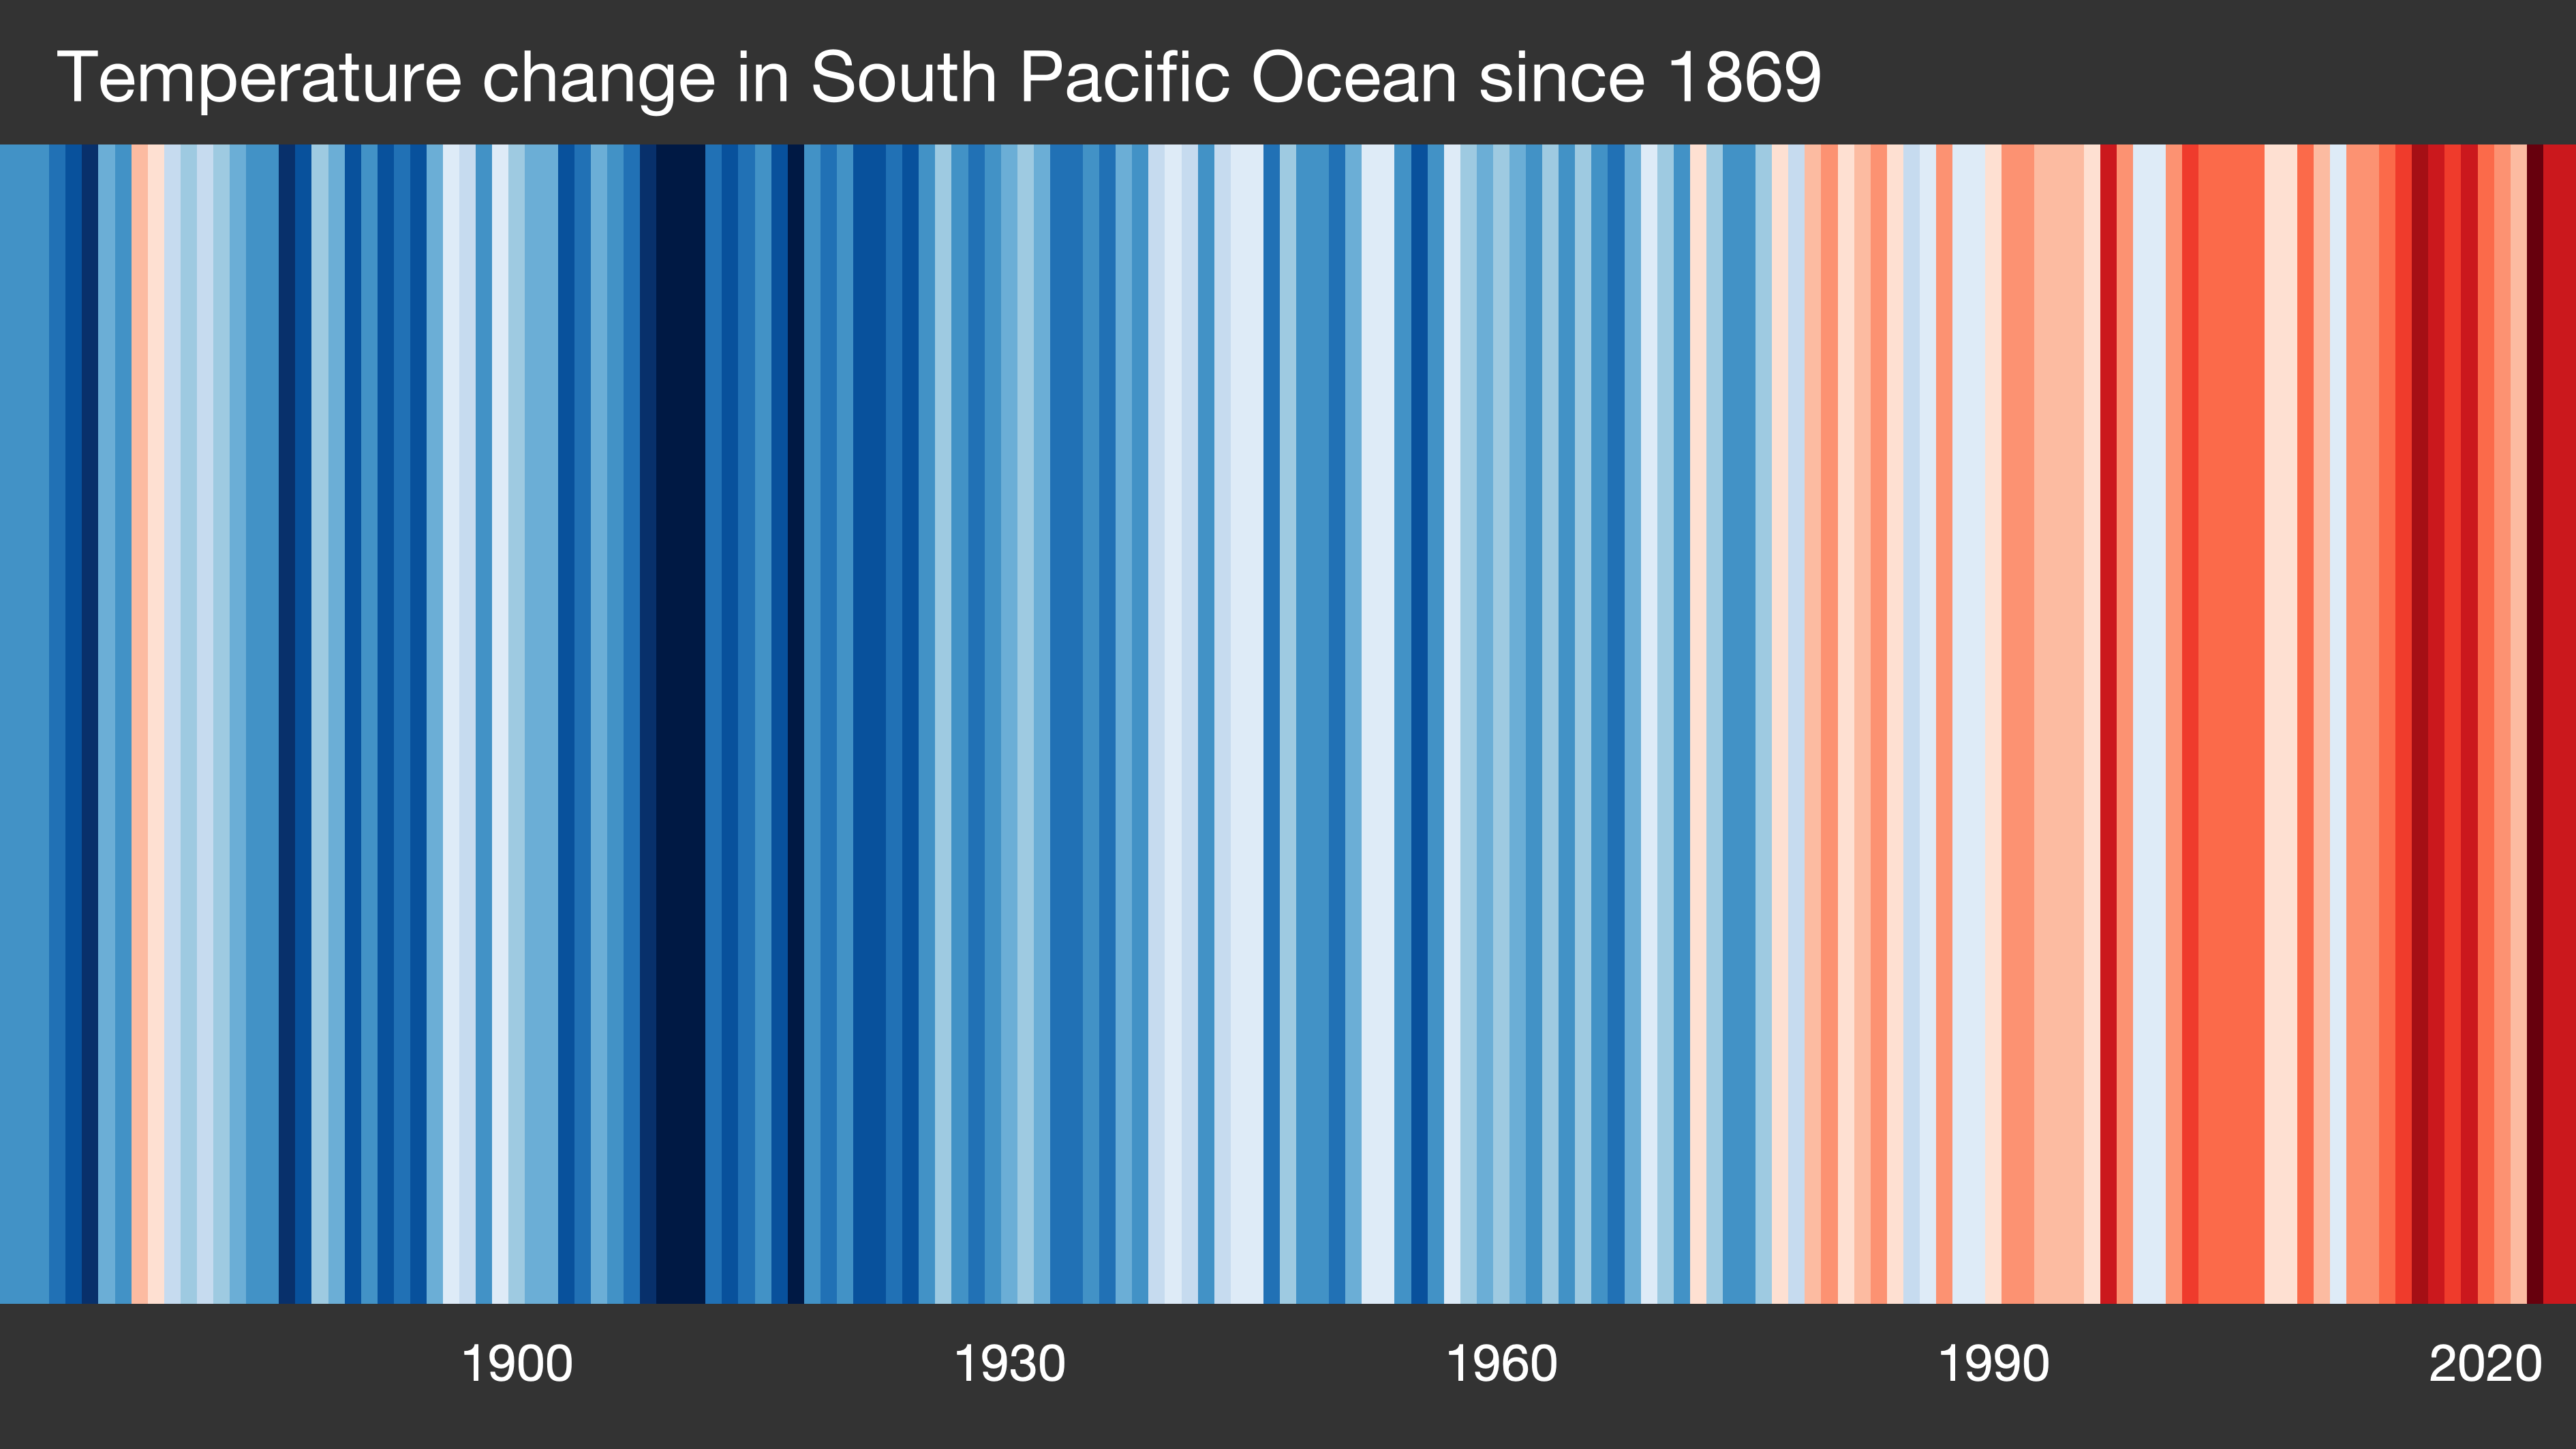
ShowYourStripes: Visualizing Climate Change Across Every Country
Visualising how the climate has changed for every country across the globe
showyourstripes.info·26d ago
6 Best GEO Tools to Track AI Visibility and Optimize for AI Search in 2026
As AI models like ChatGPT, Claude, and Perplexity replace traditional search for millions of users, the best geo tools of 2026 give marketer
Comments
Sign in to join the conversation.
No comments yet. Be the first.