Interactive US Job Market Visualizer Tool Using BLS Occupational Data
By
andygcook
Crusty in the right places. Worth the chew.
Summary
This article describes a research tool called "US Job Market Visualizer" that provides interactive visualizations of 342 occupations from the Bureau of Labor Statistics Occupational Outlook Handbook. The tool covers 143 million jobs across the US economy, with each rectangle's area proportional to total employment. Users can toggle between different metrics including BLS projected growth outlook, median pay, education requirements, and AI exposure. The tool is presented as a development tool for exploring BLS data visually rather than a formal economic publication, and includes LLM-powered coloring features in its source code.
Key quotes
· 4 pulledThis is a research tool that visualizes 342 occupations from the Bureau of Labor Statistics Occupational Outlook Handbook, covering 143M jobs across the US economy.
Each rectangle's area is proportional to total employment. Color shows the selected metric — toggle between BLS projected growth outlook, median pay, education requirements, and AI exposure.
This is not a report, a paper, or a serious economic publication — it is a development tool for exploring BLS data visually.
LLM-powered coloring: The source code includes scrapers, parser
You might also wanna read


Claude AI Adds Interactive Charts and Visualizations to Conversations
Claude AI now features interactive charts, diagrams, and visualizations that appear inline during conversations to help users understand con
 claude.com·2mo ago
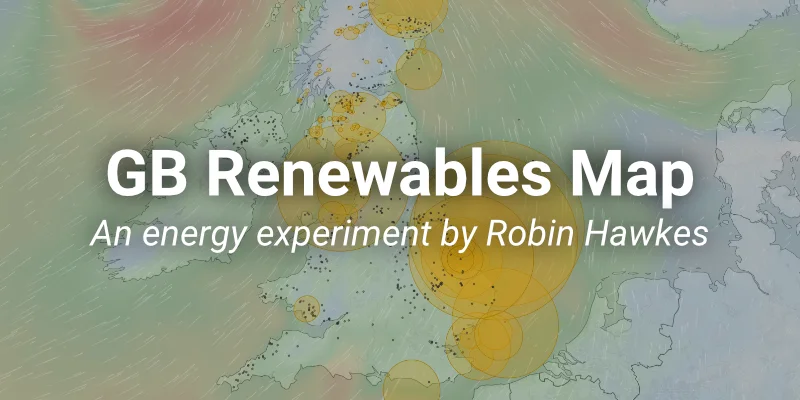
Interactive Map Shows Real-Time Renewable Energy Generation in Great Britain
The article describes an interactive live map created by Robin Hawkes that visualizes real-time renewable energy generation across Great Bri
 renewables-map.robinhawkes.com·3mo ago
FuzzyGraph: Visualizing Mathematical Equations Beyond Binary Mode to Reveal Hidden Patterns
The article introduces FuzzyGraph, a novel approach to visualizing mathematical equations that goes beyond traditional binary graphing. Inst
 gods.art·6mo ago
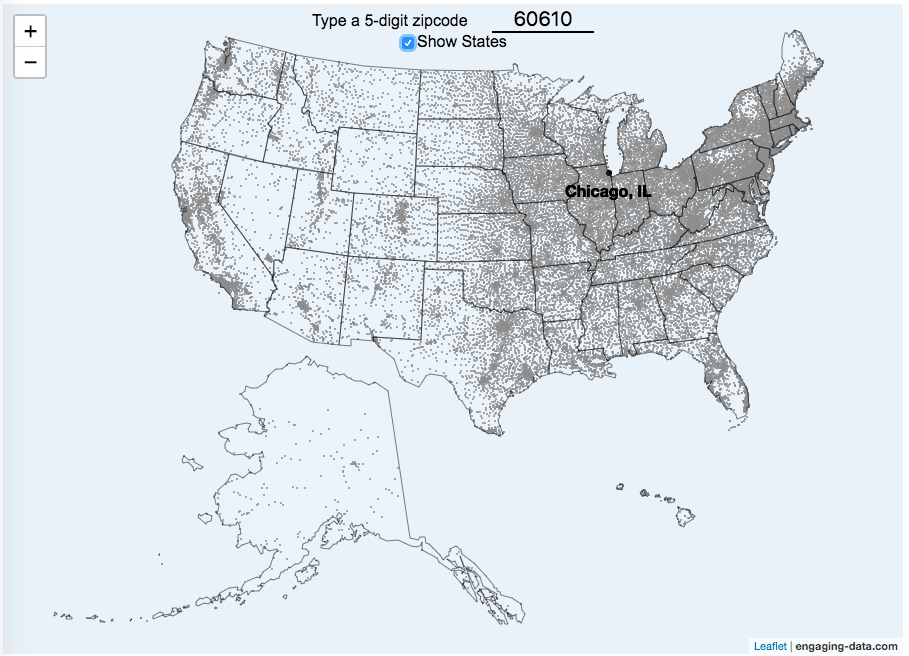
Interactive US Zip Code Map Visualization
This article describes an interactive zip code map of the United States that visualizes over 42,000 zip codes across all 50 states. The map
Interactive 3D Visualization of Large Language Model Architecture
A 3D animated visualization tool that provides a walkthrough of how Large Language Models (LLMs) work, offering visual insights into their i

Engineering Professor Explains How Electric Cars Work and Answers Common EV Questions
Professor Willett Kempton, an electrical and computer engineering expert from the University of Delaware, answers common internet questions
 wired.com·1h ago