FuzzyGraph: Visualizing Mathematical Equations Beyond Binary Mode to Reveal Hidden Patterns
By
calebm
Crisp on the outside, thoughtful on the inside. A keeper.
Summary
The article introduces FuzzyGraph, a novel approach to visualizing mathematical equations that goes beyond traditional binary graphing. Instead of only showing where equations are exactly equal (traditional graphing), FuzzyGraph visualizes equations in a fuzzy/non-binary mode, displaying not just exact equality but also where equations are nearly equal and where the error is high. This reveals the 'shadows' or subtle patterns in mathematical relationships that conventional graphing methods miss.
Key quotes
· 3 pulledIf you've ever graphed equations, chances are you have only ever graphed equations in what I refer to as 'Binary mode' - which draws a line where the equation is EXACTLY equal, and leaves white everywhere else.
FuzzyGraph, on the other hand, visualizes equations in a Fuzzy/Non-Binary mode - showing not only where an equation are exactly equal, but also where the equation nearly equal and where the equation is far from equal (where the error is high).
And when we visualize equations in this fuzzy mode, we can see the 'shadows' lurking in the equations - the subtle patterns and relationships that traditional graphing methods miss.
You might also wanna read
Interactive US Job Market Visualizer Tool Using BLS Occupational Data
This article describes a research tool called "US Job Market Visualizer" that provides interactive visualizations of 342 occupations from th


Claude AI Adds Interactive Charts and Visualizations to Conversations
Claude AI now features interactive charts, diagrams, and visualizations that appear inline during conversations to help users understand con
 claude.com·2mo ago
Autoformalization Project Achieves 130,000 Lines of Topology in Two Weeks Using LLMs for $100
A research project has successfully autoformalized 130,000 lines of general topology from the Munkres textbook in just two weeks using LLMs
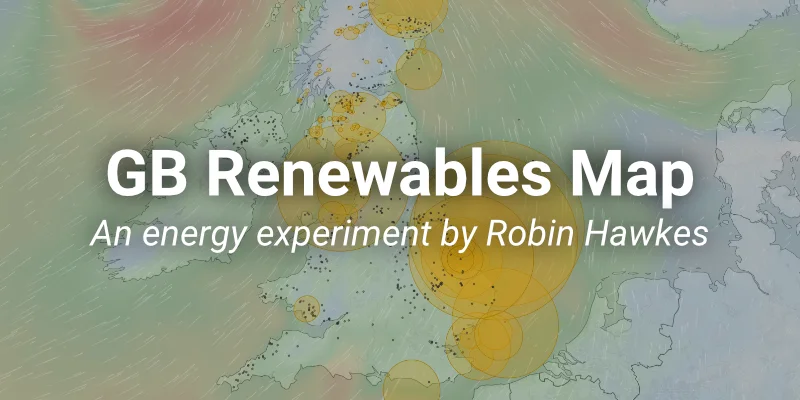
Interactive Map Shows Real-Time Renewable Energy Generation in Great Britain
The article describes an interactive live map created by Robin Hawkes that visualizes real-time renewable energy generation across Great Bri
 renewables-map.robinhawkes.com·3mo ago
The Imperfect Nature of Mathematical Proof Verification Systems
The article discusses the inherent limitations and potential failures in mathematical proof verification systems, challenging the perception

The Mathematics of Data Structures: Why No Single Storage Solution Is Optimal
The article explores the fundamental trade-offs in data structure design, explaining that there's no single optimal way to store information
 quantamagazine.org·4mo ago