Euphony: Browser-based tool for visualizing AI chat data and Codex logs as interactive timelines
By
Rohan Chaubey
Crisp on the outside, thoughtful on the inside. A keeper.
Summary
Euphony is a tool that renders AI chat data (Harmony JSON/JSONL conversations) and Codex CLI session logs into interactive, filterable timeline views in the browser. It's designed for AI engineers debugging agent workflows and teams building on gpt-oss models, helping them visualize and browse complex conversation and log data more effectively.
Key quotes
· 3 pulledRender AI chat data and Codex logs into browsable views
Visualizes Harmony JSON/JSONL conversations and Codex CLI session logs as interactive, filterable timelines in the browser
For AI engineers debugging agent workflows and teams building on gpt-oss models
You might also wanna read

claude-replay: Convert AI Coding Agent Sessions into Interactive HTML Replays
claude-replay is an open-source tool that converts AI coding agent session logs (from Claude Code, Cursor, Codex CLI, Gemini CLI, and OpenCo
 github.com·2mo ago
Anthropic's Claude AI Now Generates Custom Charts and Visualizations in Conversations
Anthropic has launched a new feature for its Claude AI chatbot that enables it to generate custom charts, diagrams, and visualizations durin
1Code: Open-Source Orchestration Layer for AI Coding Agents (Claude Code, Codex)
1Code is an open-source coding agent client and orchestration layer that supports multiple AI coding assistants including Claude Code and Co
github.com·4mo ago
Harmony: AI-Powered Note-Taking and Transcription Tool for Discord
Harmony is an AI-powered note-taking and transcription tool designed specifically for Discord. It transcribes, summarizes, searches, and ana
 harmonynotetaker.ai·4mo ago
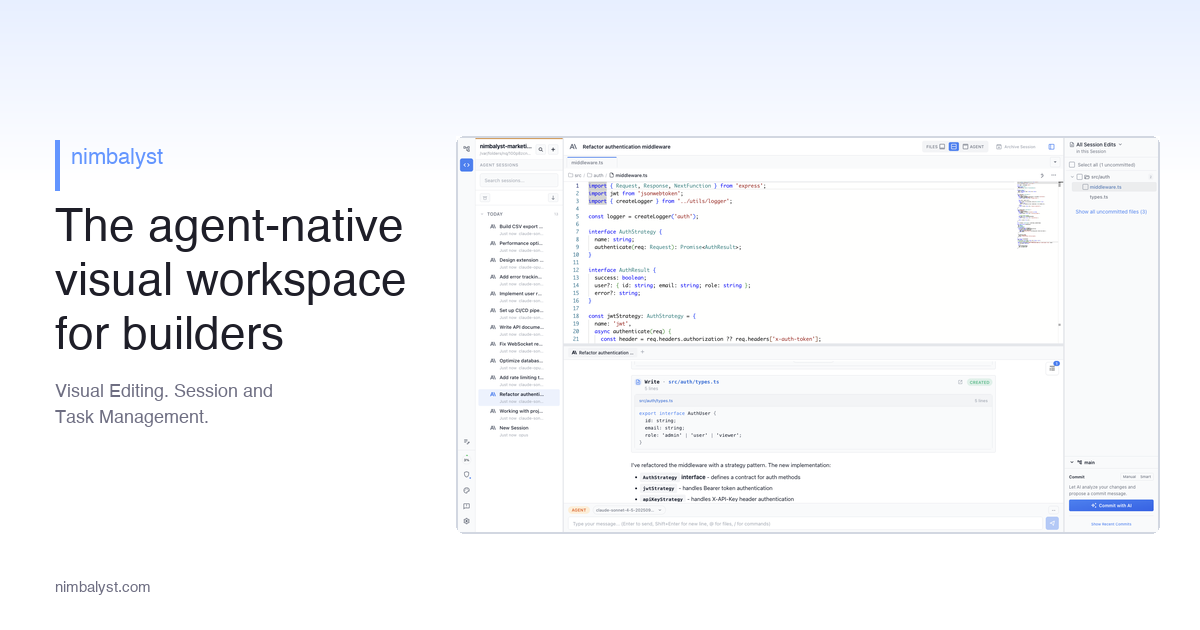
Nimbalyst: Visual Workspace Platform for AI Agent Collaboration with Codex and Claude Code
Nimbalyst is a visual workspace platform designed for AI agent collaboration, specifically for working with Codex and Claude Code. It provid
 nimbalyst.com·5mo ago
Claude AI Adds Interactive Charts and Visualizations to Conversations
Claude AI now features interactive charts, diagrams, and visualizations that appear inline during conversations to help users understand con
 claude.com·2mo ago