Datastripes Lens: Browser-Based Data Visualization Tool with AI Insights
By
Vincenzo Manto
Sketches a bagel but doesn't bake it through.
Summary
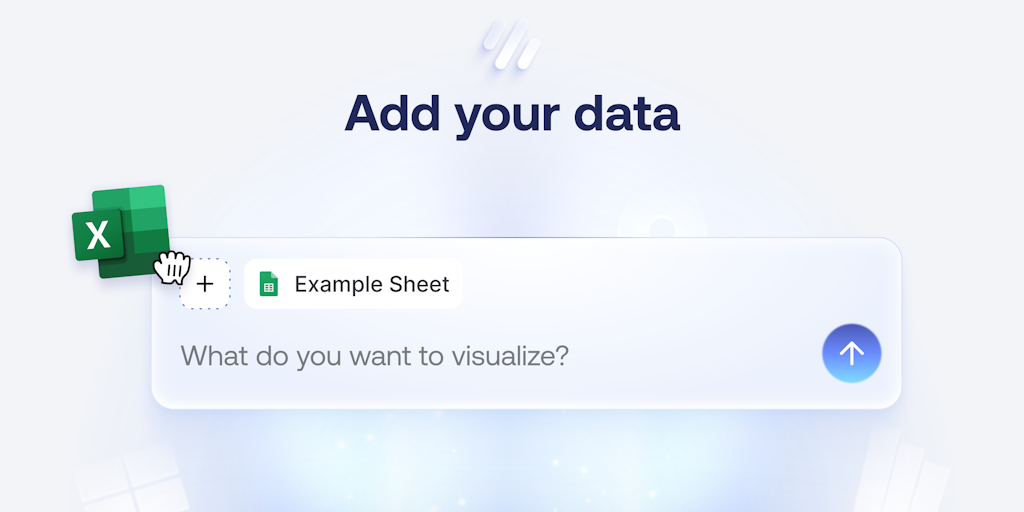
Datastripes Lens is a browser-based data visualization tool that transforms static web data into interactive charts and dashboards. The tool addresses the common frustration of manually copying data from web pages into spreadsheets by providing 300+ drag-and-drop nodes for instant visualization. Key features include AI-powered insights that generate dashboards, narrate charts, and even create data-to-voice podcasts, all requiring zero setup and working directly in the browser.
Key quotes
· 5 pulledDatastripes Lens is my answer to that problem. It's a 'magic lens' for your browser that instantly turns any data on any webpage into beautiful, interactive visualizations.
The built-in AI isn't just crunching numbers, it's telling the story for you. It can auto-generate dashboards, narrate your charts, or even turn your data into a podcast.
Datastripes is made for anyone who hates wasting time on boring, over-complicated tools.
It's slow, tedious, and kills curiosity.
The super easy-to-use web data engine with 300+ drag & drop nodes, AI insights, data-to-voice podcasts and even narrated dashboards.
You might also wanna read

Graphy: A Collaborative Data Visualization Platform Launches on Product Hunt
Graphy is a data visualization platform designed to be user-friendly and collaborative, aiming to empower users with data visualization tool
 Product Hunt·10mo ago
Anthropic releases Claude Opus 4.8, announces broader Mythos-class model access
Anthropic has released Claude Opus 4.8 to all users with unchanged pricing, featuring improvements in model honesty and reliability. The com
 helpnetsecurity.com·1d ago
Google Unveils Gemini 3.5 Flash, Spark Agents, and Omni World Model at I/O 2026
At Google I/O 2026, Google announced Gemini 3.5 Flash, Gemini Spark, and Omni as part of its strategy to compete with OpenAI and Anthropic.
 opendatascience.com·3d ago
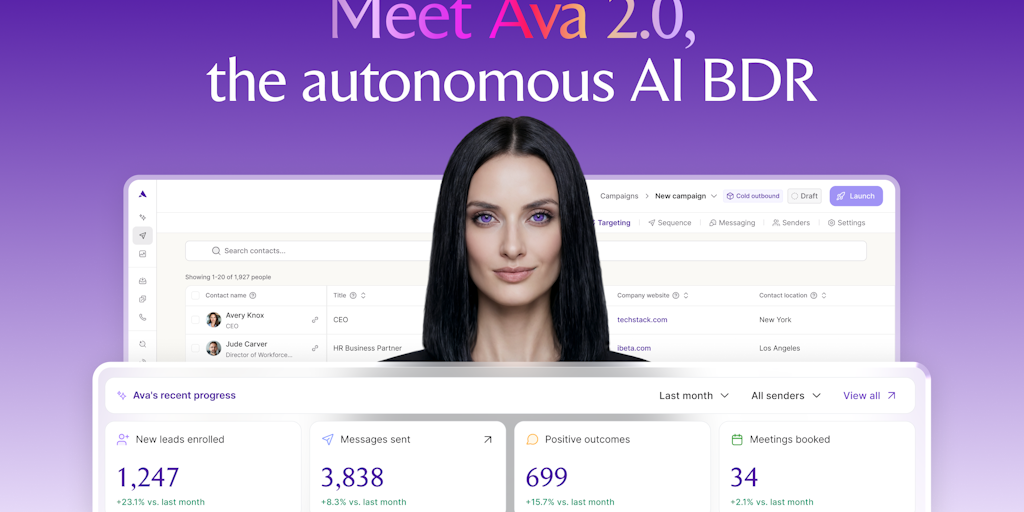
Ava 2.0: Autonomous AI BDR for outbound sales launches on Product Hunt
Artisan co-founder and CEO Jaspar launches Ava 2.0, an AI-powered Business Development Representative (BDR) that autonomously runs outbound
 Product Hunt·4d ago
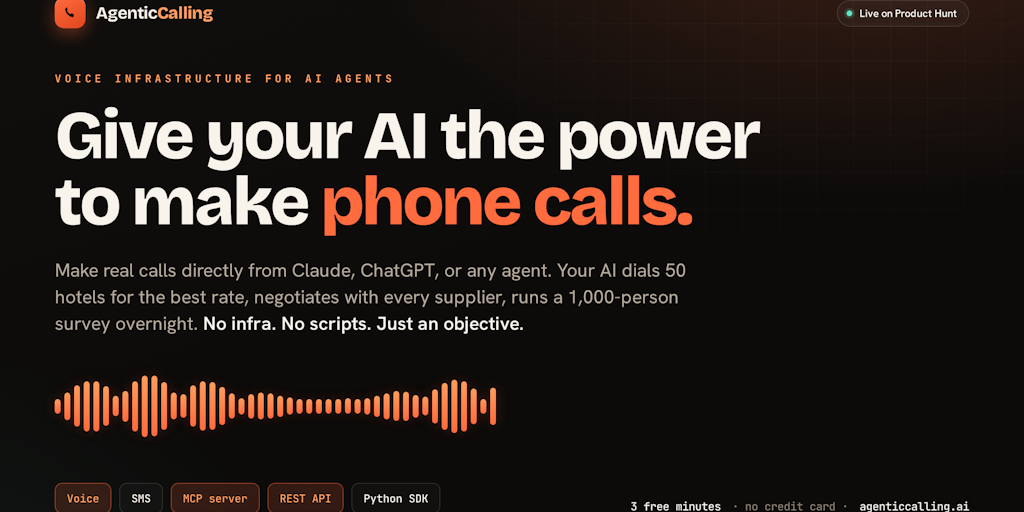
AgenticCalling Launches on Product Hunt: AI-Powered Autonomous Phone Calling Tool
AgenticCalling is a new product that gives AI agents (like Claude, ChatGPT) a dedicated phone number and the ability to make unscripted, goa
Product Hunt·5d ago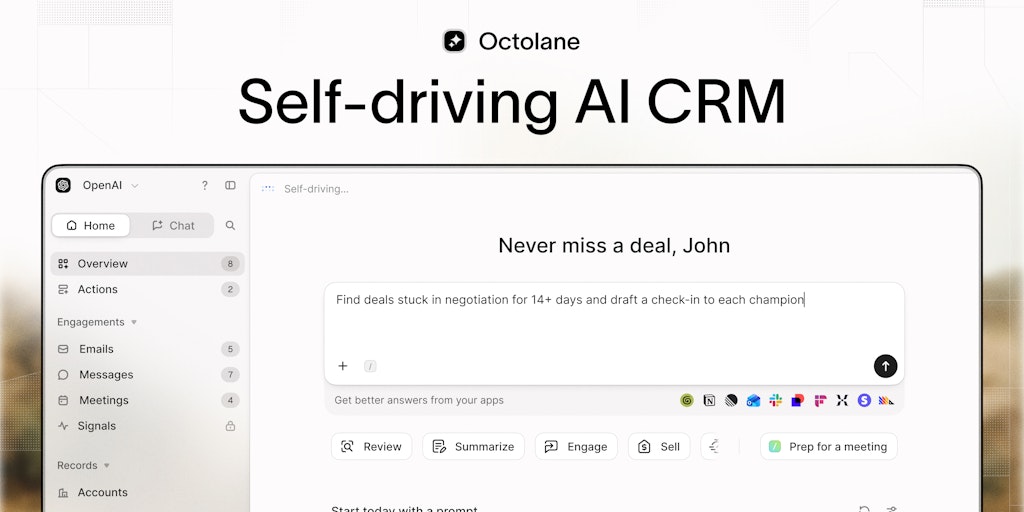
Octolane Launches Self-Driving AI CRM with Natural Language Chat Interface
Octolane is a chat-first, self-driving AI CRM that lets users interact via natural language commands like "follow up with David" or "show me
Product Hunt·5d ago