Tile

Flow Feeds

Critical discussions on media and culture.

17 feeds
Loading tags...
Tile
https://flowingdata.com/category/tutorials/feed RSS

Tutorials – FlowingData

Strength in Numbers
Last seen just now
Tile
https://stackoverflow.com/feeds RSS

Recent Questions - Stack Overflow

most recent 30 from stackoverflow.com
Last seen 1 month ago 31 views
Tile
https://www.flowjournal.org/comments/feed/ RSS

Comments for Flow

A Critical Forum on Media and Culture
Last seen 1 month ago 9 views
Tile
http://www.flowjournal.org/feed/ RSS

Flow

A Critical Forum on Media and Culture
Last seen 1 month ago 4 views
Tile
https://www.flowjournal.org/feed/ RSS

Flow

A Critical Forum on Media and Culture
Last seen 1 month ago 8 views
Tile
https://stackoverflow.blog/feed RSS

Stack Overflow Blog

Essays, opinions, and advice on the act of computer programming from Stack Overflow.
Last seen 1 month ago 51 views
Tile
https://stackoverflow.blog/feed/ RSS

Stack Overflow Blog

Essays, opinions, and advice on the act of computer programming from Stack Overflow.
Last seen 1 month ago 35 views
Tile
https://stackoverflow.blog/podcast/feed/ RSS

The Stack Overflow Podcast

Hosted by Joel Spolsky, Jay Hanlon, David Fullert…
Last seen 1 month ago 36 views
Tile
https://stackoverflow.com/feeds/tag/python RSS

Active questions tagged python - Stack Overflow

most recent 30 from stackoverflow.com
Last seen 1 month ago 28 views
Tile
https://stackoverflow.com/feeds/tag/java RSS

Active questions tagged java - Stack Overflow

most recent 30 from stackoverflow.com
Last seen 1 month ago 25 views
Tile
https://flowingdata.com/feed/ RSS

FlowingData

Strength in Numbers
Last seen 2 weeks ago 7 views
Tile

View full article
Tile
Select a feed to view its content
Loading feed entries...

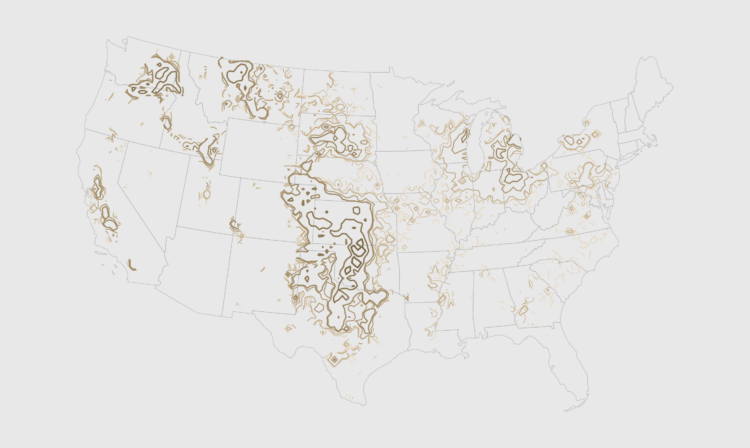
✚ How to Map with Contour Lines and GeoTIFF in R

✚ How to Map with Contour Lines and GeoTIFF in R

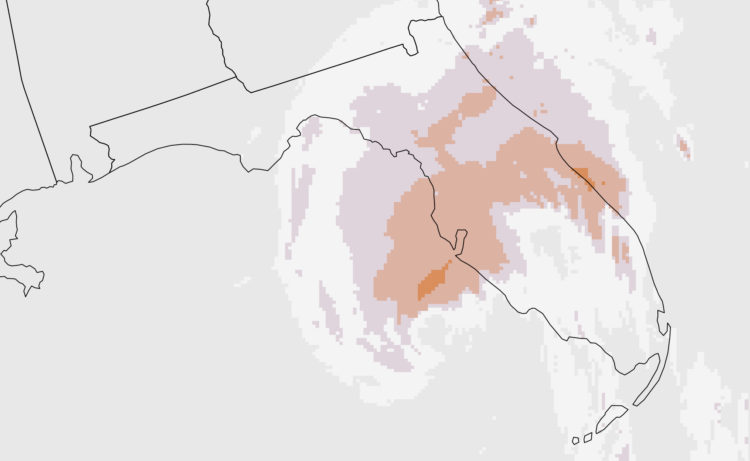
✚ Make the Chart: Precipitation Map as Animated GIF

✚ Make the Chart: Precipitation Map as Animated GIF

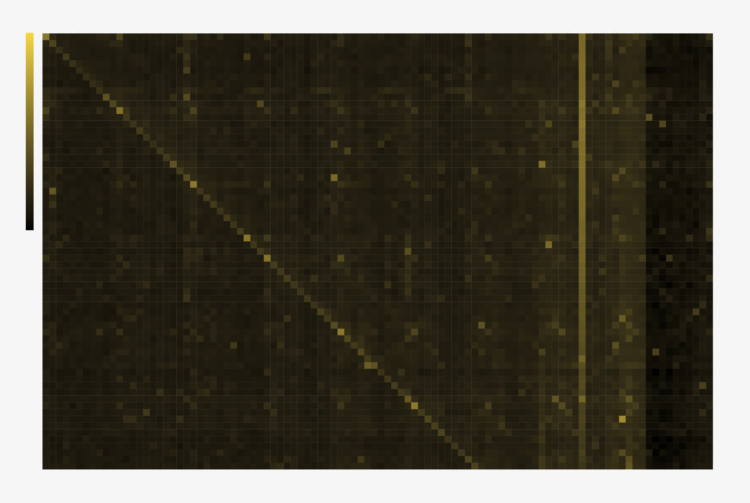
✚ Heatmaps and Defining Color Scales

✚ Heatmaps and Defining Color Scales

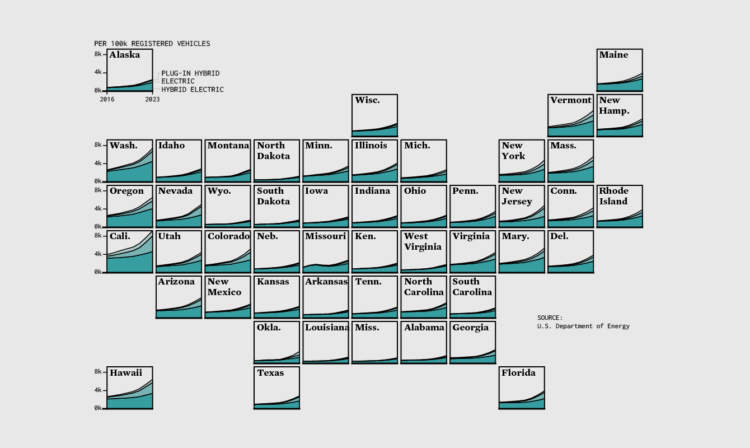
✚ Make the Chart: Grid Map with Stacked Areas

✚ Make the Chart: Grid Map with Stacked Areas

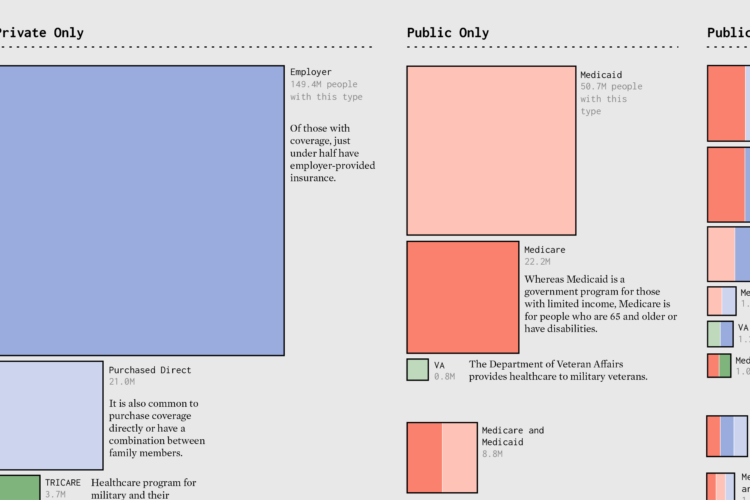
✚ Make the Chart: Scaled Squares with Color Bands

✚ Make the Chart: Scaled Squares with Color Bands

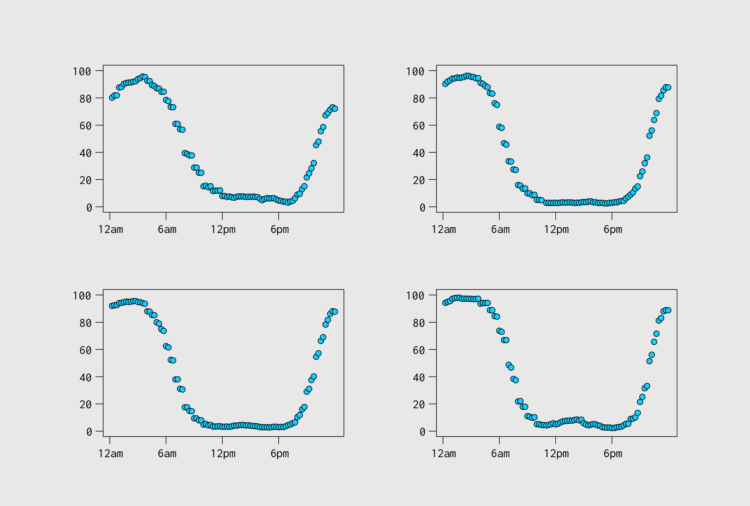
✚ Aggregating Time Use Microdata

✚ Aggregating Time Use Microdata

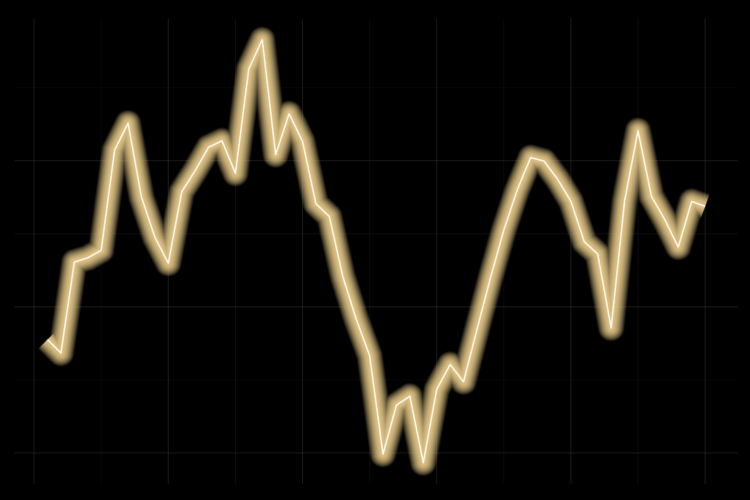
✚ Line Chart with Decorative Neon Accents

✚ Line Chart with Decorative Neon Accents

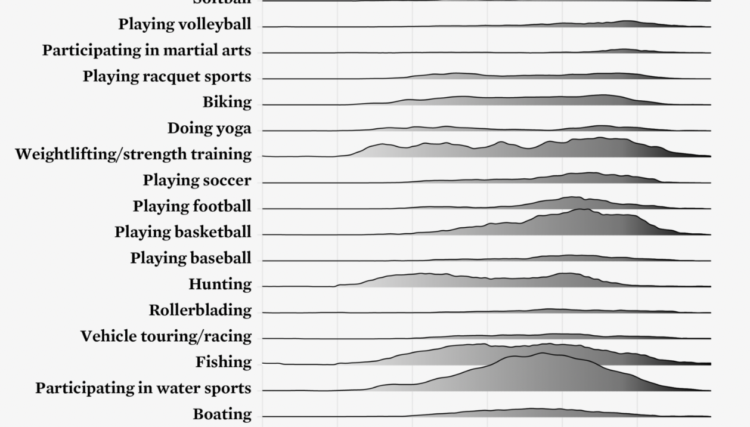
✚ Ridgeline Chart with Color Gradients

✚ Ridgeline Chart with Color Gradients

✚ Make the Chart: Scatterplot Using Text Instead of Dots

✚ Make the Chart: Scatterplot Using Text Instead of Dots

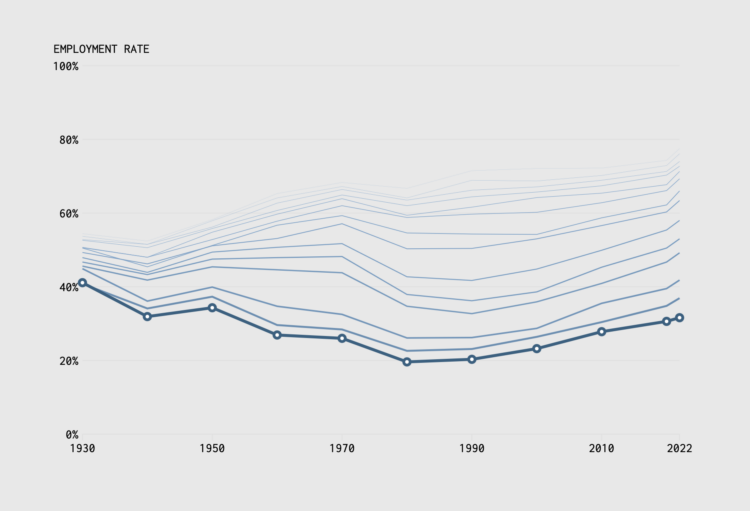
✚ Make the Chart: Interactive Line Chart with Ghost Trails

✚ Make the Chart: Interactive Line Chart with Ghost Trails